
Fig. 5.
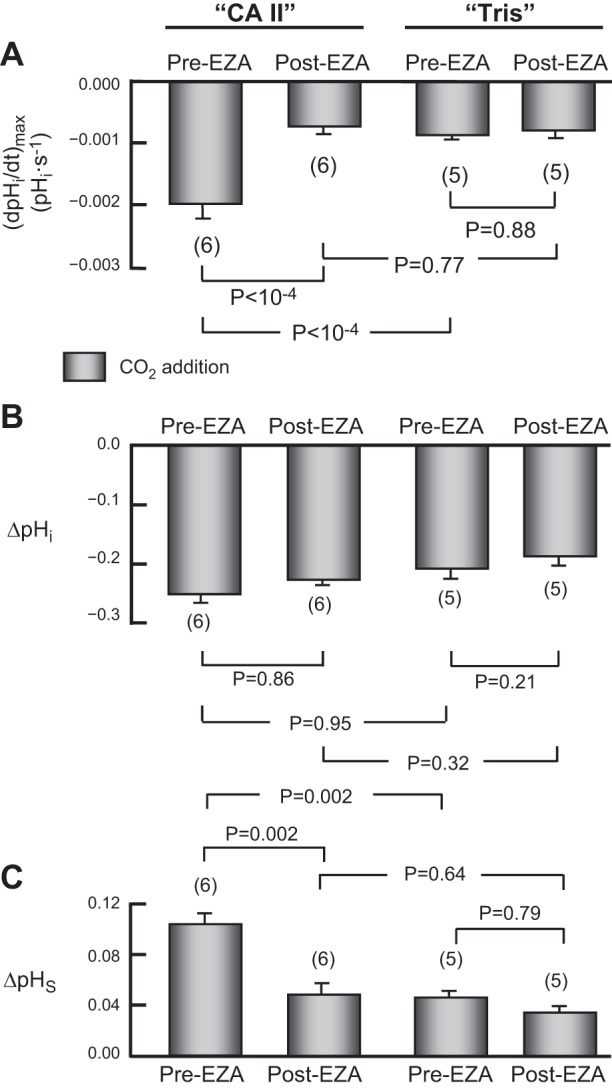
Summary of the effects of EZA on pHi and pHS. This figure summarizes data relating to CO2 addition from a larger number of experiments, such as those in Fig. 4, on oocytes injected with CA II in Tris buffer, or only Tris buffer. After an assay during which we switched the extracellular solution from ND96 to 1.5% CO2/10 mM HCO3−, in the absence of EZA (Pre-EZA), we exposed the same oocyte to 400 μM EZA for 3 h, and then repeated the assay (Post-EZA). A: maximal rates of pHi change (negative direction) produced by the extracellular solution switch. B: changes in steady-state pHi produced by the switch to CO2/HCO3−. C: maximal changes in pHS (positive direction) produced by the extracellular solution switch. Values are means ± SE, with nos. of oocytes in parentheses. We performed a one-way ANOVA (overall P values: P < 10−4 in A, P = 0.38 in B, and P = 0.0012 in C), followed by a Student-Newman- Keuls (SNK) analysis (P shown for individual comparisons). The mean initial pHi for “CA II” oocytes in the CO2/HCO3−-free ND96 solution was 7.13 ± 0.11 (n = 6), which is not significantly different from the mean value for “Tris” oocytes, 7.05 ± 0.07 (n = 5; P = 0.93). For both “CA II” and “Tris” oocytes, EZA had no effect on the initial pHi.