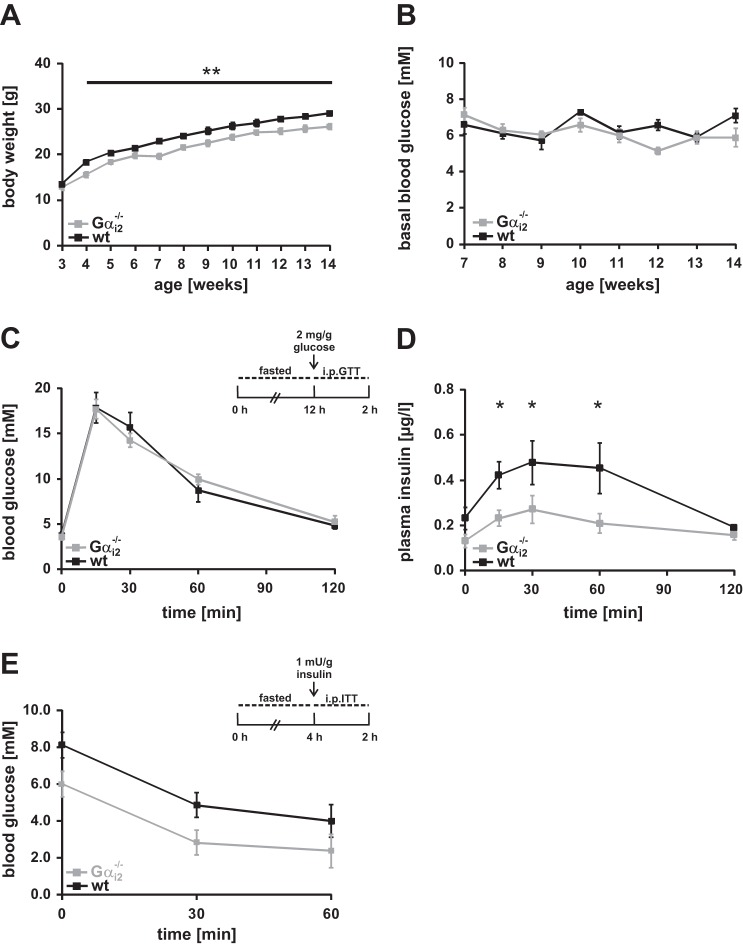
Fig. 4.
Metabolic phenotyping of Gαi2−/− animals. A: body weight gain of wt and Gαi2−/− mice. Body weight of Gαi2−/− mice is significantly reduced. B: blood glucose levels determined in wt and Gαi2−/− mice over time, which are comparable between the 2 genotypes (n = 16 animals per genotype). C: blood glucose levels in 8- to 10-wk-old wt (■) and Gαi2−/− ( ) mice following ip application of glucose after overnight fasting are equal (n = 8 animals per group). D: plasma insulin levels during ip glucose tolerance testing in wt and Gαi2−/− animals (n = 8 animals per group). Plasma insulin levels are significantly reduced at 15, 30, and 60 min. E: insulin tolerance testing in 4-h-fasted wt and Gαi2−/− mice (n = 6 per genotype). *P < 0.05.

