Fig. 9.
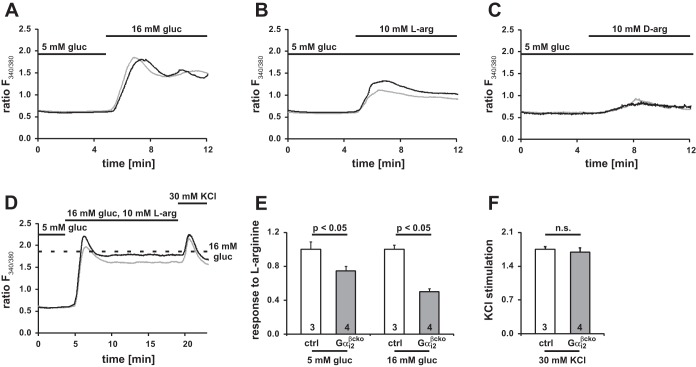
Calcium measurements in dispersed ctrl and Gαi2βcko β-cells. Representative [Ca2+]i ratios (ctrl, black line; Gαi2βcko, gray line) elicited by 16 mM glucose (A), 10 mM l-arginine at 5 mM glucose (B), or 10 mM d-arginine at 5 mM glucose (C) (A, ctrl n = 3 mice, 465 cells; Gαi2βcko n = 4 mice, 298 cells; B, ctrl n = 7 mice, 606 cells; Gαi2βcko n = 5 mice, 687 cells; C, n = 3 mice, 447 cells; Gαi2βcko n = 3 mice, 413 cells). D: representative [Ca2+]i response to 16 mM glucose in combination with 10 mM l-arginine and final application of KCl (ctrl n = 3 mice, 585 cells; Gαi2βcko n = 4 mice, 687 cells). Dotted line indicates maximum response to 16 mM glucose shown in A. E: maximum response to l-arginine was significantly reduced by 25% at 5 mM and 44% at 16 mM glucose concentrations in Gαi2βcko β-cells compared with ctrl β-cells, whereas the response is the difference between the maxima obtained with glucose plus l-arginine (D) minus the maxima obtained with glucose alone (A); n = 3–4 animals per group. F: maximum depolarization evoked by 30 mM KCl (n = 3–4 animals per group). All recordings were started at 5 mM glucose with additions as shown on the figure.

