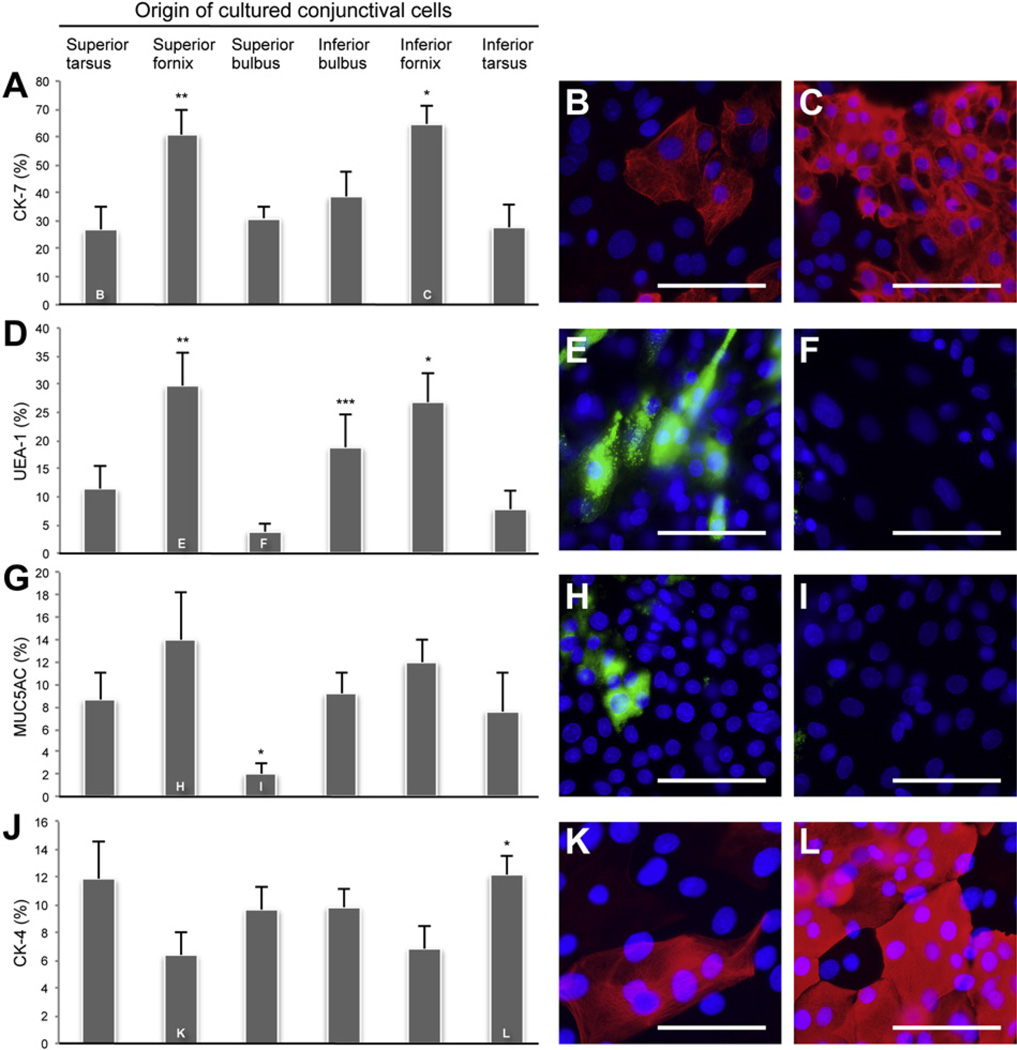
Fig. 3.
Comparison of mean ± SEM (n = 6) percentage of CK-7+, UEA-1+, MUC5AC+ and CK-4+ cells in primary culture from six conjunctival regions. (A) *P < 0.05 compared with superior tarsus, superior bulbus, inferior tarsus, and inferior bulbus. **P < 0.05 compared with superior tarsus, superior bulbus and inferior tarsus. Immunostaining of anti-CK-7 (red) in primary culture from superior tarsus (B) and inferior fornix (C). (D) *P < 0.05 compared with superior tarsus, superior bulbus and inferior tarsus. **P < 0.05 compared with superior bulbus and inferior tarsus. ***P < 0.05 compared with superior bulbus. Staining with UEA-1 lectin (green) in primary culture from superior fornix (E) and superior bulbus (F). (G) *P < 0.05 compared with superior tarsus, superior fornix, inferior bulbus, inferior fornix, and inferior tarsus. Immunostaining of anti-MUC5AC (green) in primary culture from superior fornix (H) and superior bulbus (I). (J) *P < 0.05 compared with superior fornix and inferior fornix. Immunostaining of anti-CK-4 (red) in primary culture from superior fornix (K) and inferior tarsus (L). Nuclei were stained with DAPI (blue). All micrographs are representative of six animals. Magnification:×630. Scale bars: 100 µm.

