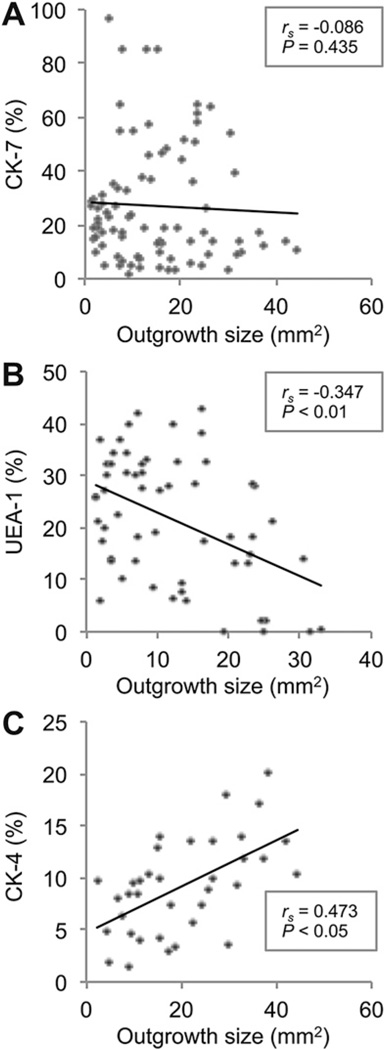
Fig. 7.
The relationships among outgrowth size and phenotype in rat primary cultures after eight days were analyzed. (A) Bivariate scattergram illustrating no apparent correlation between outgrowth size and percentage of CK-7+ cells in the culture (84 paired observations). (B) Bivariate scattergram illustrating the negative correlation between outgrowth size and percentage of UEA-1 + cells in the culture (58 paired observations). (C) Bivariate scattergram illustrating the positive correlation between outgrowth size and percentage of CK-4+ cells in the culture (27 paired observations). The Spearman’s correlation test was used. rs = Spearman’s correlation coefficient.

