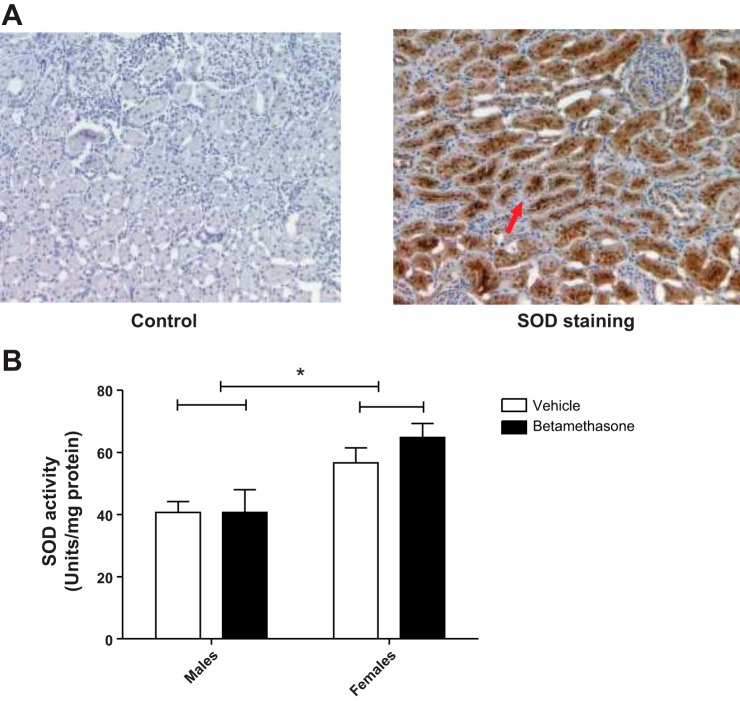
Fig. 6.
A: representative pictures with superoxide dismutase (SOD) staining in kidney cortex section are shown. Negative control (left) and SOD-positive staining in tubule cells (right, dark brown, red arrow for an example, and ×10 magnifications). B: SOD activity after uninephectomy in vehicle- and betamethasone-exposed sheep from males and females. There was an overall increase of SOD activity after uninephrectomy in females but not in males (F = 14.7, P = 0.002; n = 5 per group).

