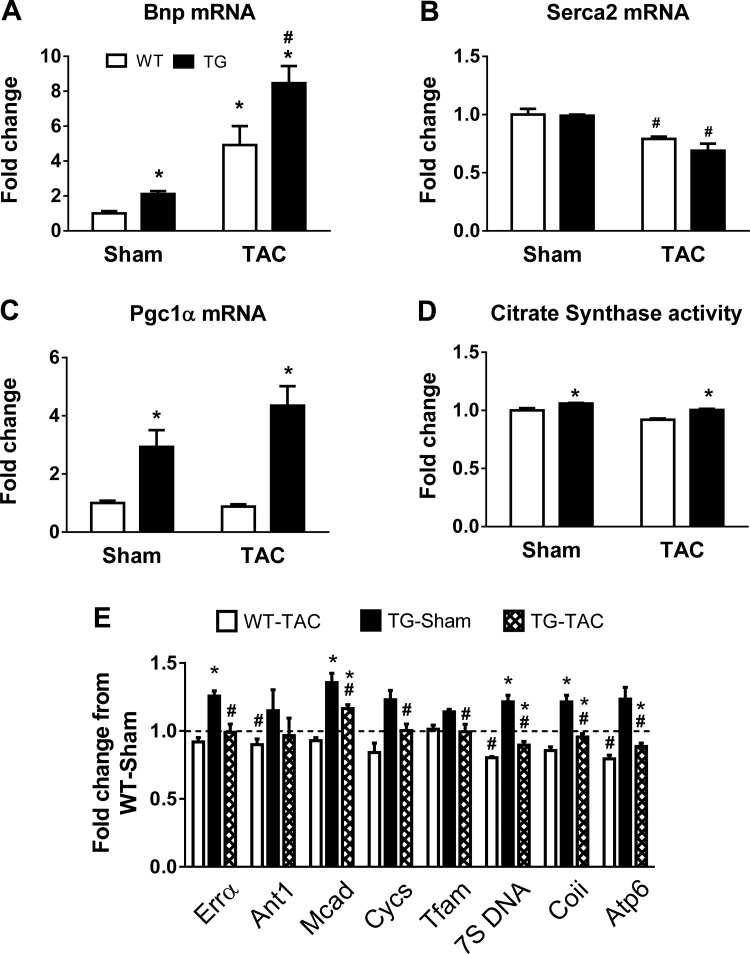
Fig. 8.
Cardiac gene expression in WT and TG mice subjected to TAC at 8 wk of age. A–C: mRNA levels of brain natriuretic peptide (Bnp; A), cardiac sarco(endo)plasmic reticulum Ca2+-ATPase 2 (Serca2; B), and PGC-1α (C). D and E: CS activity (D) and mRNA levels of PGC-1α downstream targets (E) reflecting mitochondrial biogenesis in sham-operated and TAC hearts of WT and TG mice 8 wk after surgery (n = 4 mice/group). The dotted line indicates the WT sham-operated group. *P < 0.05 vs. WT mice with the same treatment; #P < 0.05 vs. sham surgery in the same genotype.

