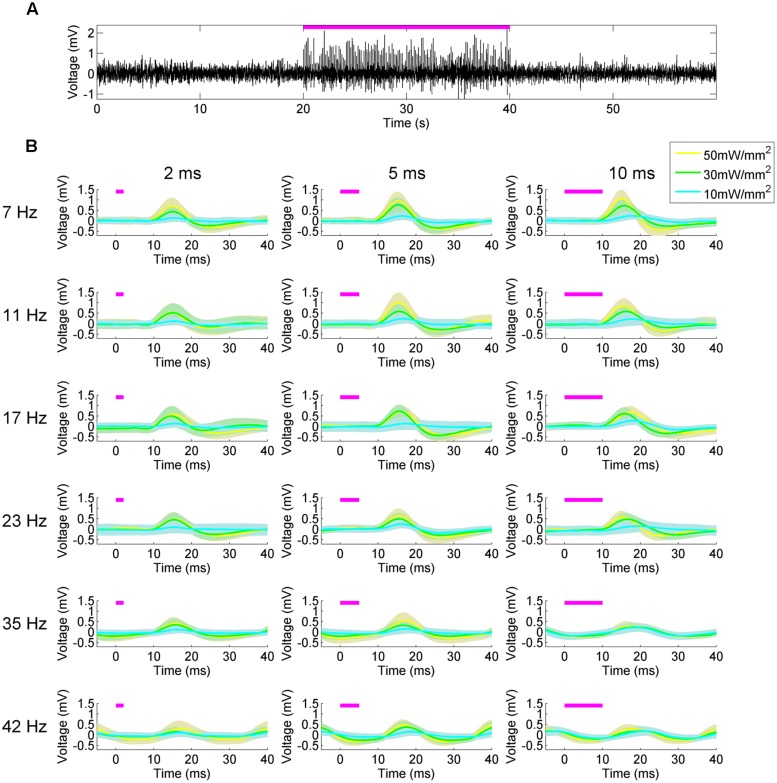
FIGURE 3.
Peristimulus average hippocampal LFP responses to medial septal stimulation reveal the influence of stimulation parameters on waveform shape. (A) Hippocampal LFP response to 50 mW/mm2, 7 Hz, 10 ms square-wave optical stimulation of the MS (magenta bar). (B) Responses to stimuli at different frequency (rows), pulse width (columns), and intensities (blue, green, yellow, respectively). Lines indicate the mean response and the shaded areas indicate the SD.

