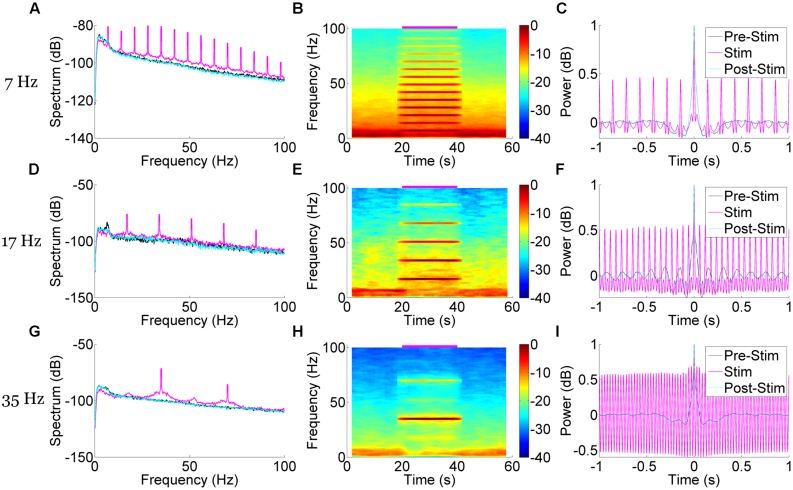
FIGURE 4.
Spectral and correlational response to medial septal pulse stimulation demonstrate time-locked and frequency specific responses. Stimulation at 50 mW/mm2, 10 ms pulse width, and 7 Hz (A–C), 17 Hz (D–F), and 35 Hz (G–I) each produced unique and frequency-specific responses in the spectrum (A,D,G), spectrogram (B,E,H), and autocorrelation (C,F,I) of the LFP signal time-locked to the stimulation. Blurred edges near stimulus onset and offset are a result of a wide (4 s) moving window that better resolved the frequency-specificity of the response. The autocorrelation demonstrates a highly correlated LFP signal at stimulation time points, suggesting a locking of oscillatory phase to the stimulus.

