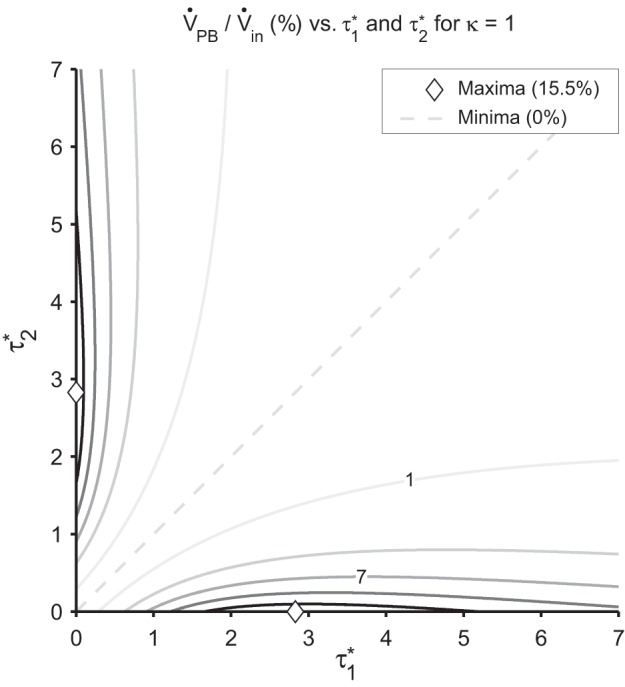
Fig. 3.

Isocontours marking 3% increments in local relative pendelluft volume as a function of the nondimensional time constants, for κ = 1. The shape of the isocontours shows the steep transition from the maximum at the ◇ (15.5%) to the minimum (0) on the line of symmetry.
