
Figure 4.
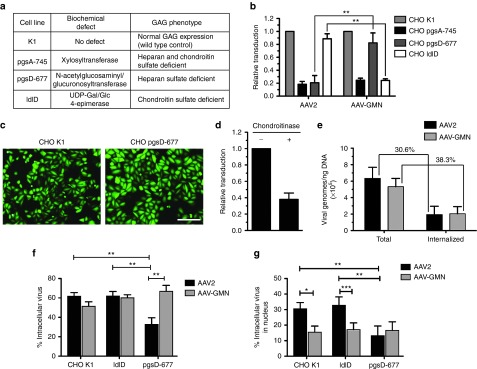
AAV-GMN transduction requires chondroitin sulfate expression. (a) Wild type and mutant CHO cell lines used for transduction experiments. The specific GAG biosynthesis phenotypes and underlying biochemical defects are listed. (b) Each CHO cell line was transduced with either AAV2 or AAV-GMN encoding an eGFP reporter, and transduction was measured by eGFP fluorometry 24 hours later. Data are presented as relative to transduction (RFU/μg of protein extract) of the wild type parent CHO K1 cell line. (c) Representative fluorescence microscopy image of CHO K1 and pgsD-677 cells transduced with AAV-GMN showing that pgsD-677 cells are larger and display greater eGFP fluorescence compared to the transduced K1 cells. (d) CHO pgsD-677 cells were treated with chondroitinase ABC prior to transduction with AAV-GMN. Transduction was measured by eGFP fluorometry 24 hours after transduction and results are shown as relative to mock-treated cells. (e) Comparison of the amount of AAV2 and AAV-GMN that binds to the cell surface and internalizes when incubated with ldlD cells. Virus was incubated for 1 hour on ice-cold cells, washed, and then incubated at 37 °C for 1 hour. Internalized virus was measured in cells treated with trypsin to remove extracellular, bound virus whereas bound and internalized (Total) virus was measured using cells that were not trypsin treated. The amount of recovered virus was measured by quantitative PCR for viral genomes. (f,g) AAV sub-cellular localization. The indicated CHO cells were transduced for 4 hours with fluorescently labeled AAV2 and AAV-GMN, and the percent of internalized and nuclear-localized AAV relative to total AAV (surface localized + internalized) was quantified. AAV2 entry is dependent on heparin expression, whereas AAV-GMN enters all cell types equivalently. In all figures, data shown are derived from ≥3 independent experiments. For b error bars are mean ± SD. **P value <0.01. For f and g error bars are mean ± SEM; *P < 0.05, **P < 0.01, and ***P < 0.001 by Mann–Whitney U–test.