
Figure 3.
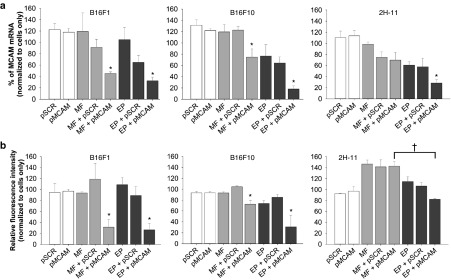
The MCAM mRNA and MCAM protein levels in B16F1, B16F10, and 2H-11 cells examined after magnetofection and gene electrotransfer with pMCAM. (a) The MCAM mRNA levels determined by qRT-PCR analysis and (b) MCAM protein levels determined by flow cytometer analysis in B16F1, B16F10, and 2H-11 cells 48 hours after magnetofection (MF) or gene electrotransfer (EP) with pMCAM. Bars represent AM ± SEM of the percentage of MCAM mRNA (N = 3) or the relative fluorescence intensity (N = 3). Asterisks indicate statistically significant differences between five control groups (untreated cells, only pSCR or pMCAM separately added to cells, MF or EP, MF + pSCR or EP + pSCR) and the group compared (MF + pMCAM or EP + pMCAM) (*P < 0.05). Crosses indicate statistically significant differences between MF + pMCAM and EP + pMCAM (†P < 0.05). All data were normalized to MCAM mRNA or the fluorescence intensity of untreated cells labeled with FITC-MCAM antibodies.