Figure 3.

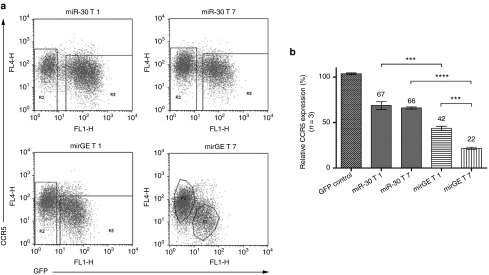
Downregulation of CCR5 in HR5 cells using lentivectors expressing different anti-CCR5 miRNA target sequences in different hairpin contexts. (a) FACS plots showing representative data from three independent experiments performed with three independent lentivector preparations. HR5 cells were transduced with lentivectors expressing either GFP alone (GFP control vector, not shown) or GFP followed by miR-30 or mirGE hairpins containing the T1 or the T7 targeting sequence (see Results and Materials and Methods for details). For determination of MFI (mean of fluorescence intensity) of transduced versus untransduced cells, square gates were used by default, and polygonal gates were used when populations were overlapping in one or two axes. MFI of GFP for the transduced population (R3) for the miR-30 T1 condition was: 150 (percentage transduction 66%), miR-30 T7 condition: 103.5 (percentage trandsuction 46%), mirGE T1 condition: 47.8 (percentage transduction 48%), and mirGE T7 condition: 30.4 (percentage transduction 23%). (b) Bar graph analysis of data in a. CCR5 downregulation was calculated by dividing the CCR5 MFI value of GFP-positive cells (transduced cells, gate R3) by the CCR5 MFI value of GFP-negative cells (untransduced cells, gate R2), within each sample. This allows for compensation of sample-to-sample variations due to slight changes in CCR5 antibody-to-cell ratios. The relative CCR5 expression in transduced cells was then displayed as percentage of CCR5 expression normalized to the internal control provided by untransduced cells. Values represent average from n = 3 independent experiments. ***P < 0.001, ****P < 0.0001 using one-way ANOVA followed by Bonferroni's mulitple comparison test. ANOVA, analysis of variance; GFP, green fluorescent protein.
