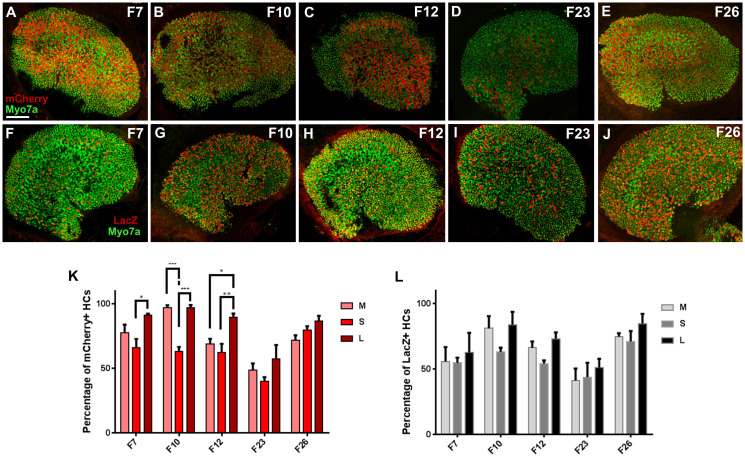
Figure 4. Atoh1-rtTA activity in the utricle.
(A–E) Representative confocal images of mCherry+ve (red) cells and Myo7a-labeled HCs (green) in the utricle for each founder line breed with the TetO-mCherry reporter at P3. (F–J) Representative confocal images of LacZ+ve (red) cells and Myo7a-labeled HCs (green) in the utricle for each founder line breed with the TetO-LacZ reporter at P3. (K) Percentage of Myo7a+ve cells that express mCherry in utricular regions of each founder line, normalized to the number of total Myo7a+ve cells in the same region. (L) Percentage of Myo7a+ve cells that express LacZ in utricular regions of each founder line, normalized to the number of total Myo7a+ve cells in the same region. Data are expressed as mean ± S.E.M for an n of 3. Statistical differences between regions were obtained using a two-way ANOVA followed by a Tukey's posthoc test. *p < 0.05, **p < 0.01, ***p < 0.001. M, medial; S, striolar; L, lateral Scale bar: 100 μm.

