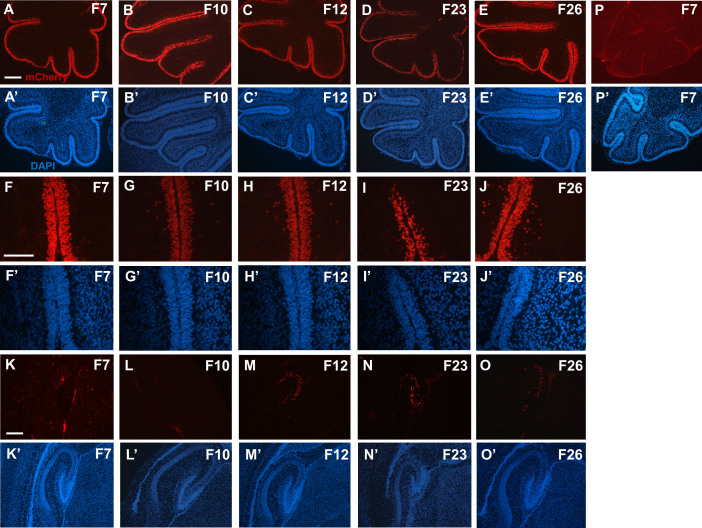
Figure 5. Atoh1-rtTA activity in the cerebellum and hippocampus.
Representative images of mCherry+ve (red) cells in the cerebella (A–J′) and hippocampus (K–O′) of each founder line at P3 after doxycycline administration from P0–P3. (P–P′) un-induced control images of Atoh1-rtTA(F7)+ve; TetO-LacZ+ve cerebella without doxycycline induction. Nuclei are labeled by DAPI (blue). Scale bars: 200 μm.

