
Figure 5. RT–PCR analysis of Foxl2 mRNA in various tissues of M. albus.
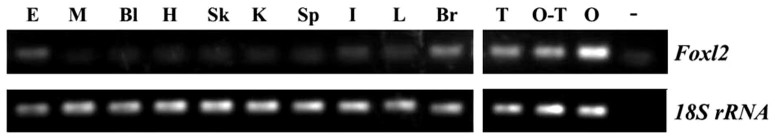
E, eye; M, muscle; Bl, blood; H, heart; Sk, skin; K, kidney; Sp, spleen; I, intestine; L, liver; Br, brain; T, testis; O-T, ovotestis; O, ovary; −, negative control; 18S rRNA, internal control. The figure was cropped, for uncropped figure, see figure S1 &S2, supplementary file.