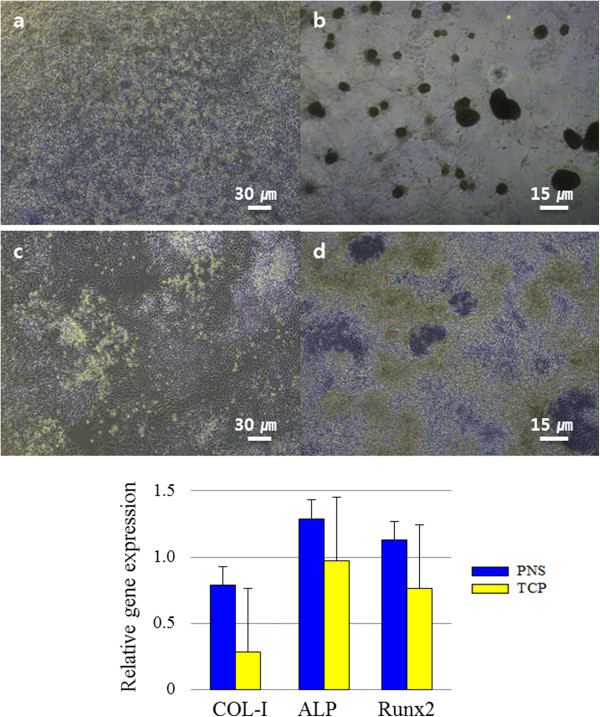
Figure 6.
Micrographs of osteoblast differentiation. (a and b) Osteoblasts on the polyaniline nanoprotrusion structure surface (PNS). (a) Before differentiation. (b) Seven days after addition of differentiation medium. (c and d) Osteoblasts on the tissue culture plate (TCP). (c) Before differentiation. (d) Seven days after addition of differentiation medium. The scale bars in (a) and (c) are 30 μm, and those in (b) and (d) are 15 μm. The bottom graphs show the relative expression levels of the COL-1, ALP and Runx2 osteoblast markers.

