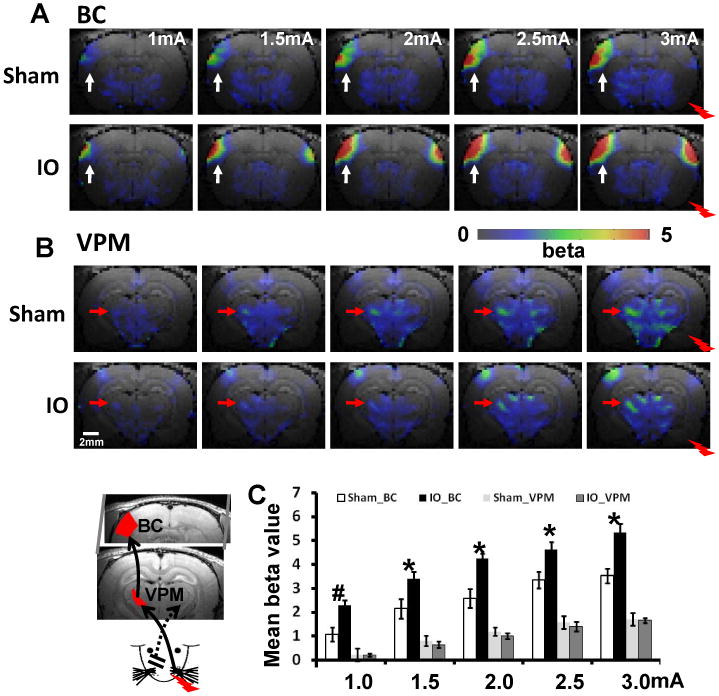
Figure 2.

BOLD responses in BC and VPM increase corresponding to the increased stimulation intensities. The schematic drawing of whisker-barrel TC circuit is shown in the inset at the left-bottom corner. The averaged beta maps of barrel cortex (BC) (A, white arrow) and VPM (B, red arrow) at five stimulation intensities from 1mA to 3mA. (C) The averaged mean beta values of BC and VPM ROIs (defined by brain atlas shown in the inset; Sham: n=8 (3 at 1.0mA); IO: n=10 (4 at 1.0mA); # means p<0.02; * means p<0.01, bar graph shows mean±SEM). The averaged fMRI time courses for each ROI were shown in the Supplementary Fig 2.
