
Figure 7.
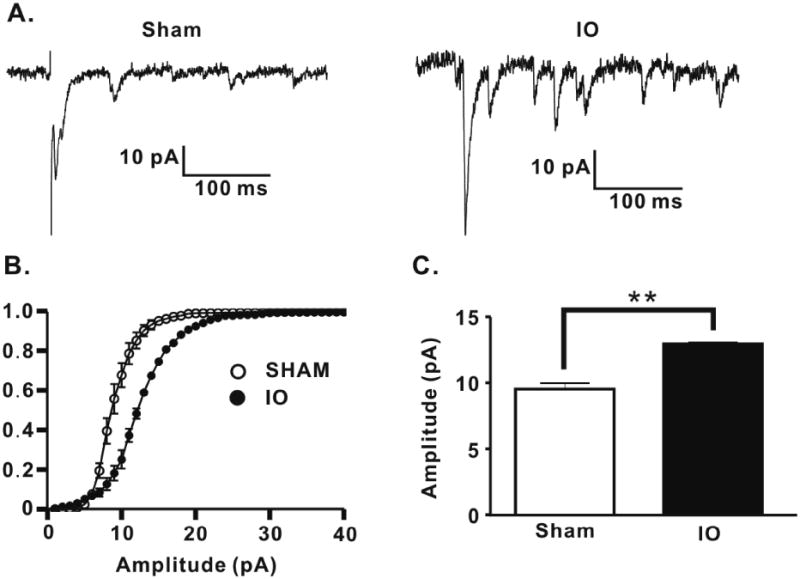
IO nerve resection causes an increase in quantal amplitude at TC inputs to layer 4 stellate cells. (A) Representative traces of Sr-evoked miniature EPSCs for both groups. (B) Averaged cumulative probability plot of Sr-evoked miniature EPSCs for all cells for both groups (Sham: n=7, open circles; IO: n=5, filled circles; Kolmogrov-Smirnov test, P<0.01). (C) Mean amplitude of Sr2+ -evoked miniature EPSCs for both groups (Sham: 9.35 ± 0.46, n=7; IO: 12.70 ± 0.29, n=5; ** p < 0.01, bar graph shows mean±SEM).