Abstract
Optical-resolution photoacoustic flowmetry allows non-invasive single-cell flow measurements. However, its operational depth is limited by optical diffusion, which prevents focusing beyond shallow depths in scattering media, as well as reducing the measurement signal-to-noise ratio (SNR). To overcome this limitation, we used binary-amplitude wavefront shaping to enhance light focusing in the presence of scattering. Here, the transmission modes that contributed constructively to the intensity at the optical focus were identified and selectively illuminated, resulting in a 14-fold intensity increase and a corresponding increase in SNR. This technique can potentially extend the operational depth of optical-resolution photoacoustic flowmetry beyond 1 mm in tissue.
Photoacoustic flowmetry (PAF) is a non-invasive measurement technique that has been demonstrated to be useful for single-cell sensing, such as the measurement of single red blood cell flow velocities in capillaries [1] and the detection of circulating tumor cells [2]. In PAF, photoacoustic (PA) signals, which are generated upon the absorption of pulsed laser light, are used. To resolve single cells, PAF requires a high spatial resolution, which is commonly achieved using optical focusing. However, at depths beyond one optical transport mean free path (diffusive regime), light propagating in optically scattering media becomes diffused, making direct focusing impossible. This limits the operational depth of PAF to ~1 mm in soft tissue [3]. Optical diffusion also reduces the amount of light arriving at the region of interest, reducing the measurement signal-to-noise ratio (SNR).
One solution to this problem is to use wavefront shaping, where a spatial light modulator (SLM) is used to shape the illuminating wavefront. The distortion of the optical wavefront due to scattering can then be corrected, refocusing light within the scattering medium [4]. The optimal phase pattern can be determined using either iterative optimization algorithms [4–7], or by directly measuring the so-called transmission matrix [8–10]. In these experiments, the optical intensity at the target is typically measured directly by using a CCD camera or photodiode [5,6,9]. However, these methods are impractical for biological applications. Recently, the feasibility of photoacoustic-guided wavefront shaping, where the optical intensities within a scattering medium were sensed remotely using PA signals, was demonstrated [10–12]. In this Letter, we report on a proof-of-principle demonstration showing that wavefront shaping can similarly be used to extend the operational depth of PAF into the diffusive regime.
Most wavefront shaping implementations use liquid crystal SLMs to modulate the phase of the wavefront. However, for biological applications, the length of time required to obtain the optimized phase pattern is important. The optimized phase pattern must be obtained and displayed on the SLM within the speckle decorrelation time of the object, which is on the order of milliseconds for living tissue, depending on the probing depth [13]. Liquid-crystal SLMs have frame rates of ~100 fps, which are much too slow. For this reason, we chose to use digital micromirror devices (DMDs), which have switching speeds up to tens of kilohertz. DMDs are binary-amplitude SLMs; each element is a micromirror that can be toggled between on or off states.
In the past, computer holograms were used to convert amplitude to phase modulation [9]. However, due to low diffraction efficiency, only ~20% of the incident light was usable, making DMDs impractical as phase modulators. To overcome this limitation, we make use of amplitude-modulated wavefront shaping [14]. In this technique, the input optical modes which do not contribute constructively to the optical focus are rejected by turning off the corresponding DMD pixels. The remaining modes therefore add constructively to form an optical focus. Previously, these optical modes were identified using the continuous sequential (CS) algorithm, where the change in the optical intensity was measured by turning a group of pixels (segment) on one at a time. However, in this case, the signal arises from just a single DMD segment, resulting in a low measurement SNR [15], contributing to measurement errors. Here, we used Hadamard multiplexing [8,10] to utilize the full set of DMD pixels, thereby increasing the measurement SNR over the CS algorithm. Unlike previous implementations of Hadamard multiplexing which relied on phase-shifting holography to measure the transmission matrix [8,9], we will show that an optimal transmission pattern can be obtained by only measuring the optical intensity.
We start by explaining how our measurement procedure works. An optical field mode Eout beyond a scattering medium is related to the input optical field by
| (1) |
where tn is an element of the transmission matrix, with amplitude An and phase Φn, and is the optical field of the n-th input mode, where each mode represents the field contribution from each independently controlled DMD segment. N is therefore the total number of these segments. We have also assumed that and . To perform the multiplexing, we used the concept of “virtual elements”, formed by linear combinations of the DMD micromirrors using the Hadamard basis, as introduced by Herbert et al. for ultrasound transducers [15]. The electric field εm generated by the m-th combination is then given by
| (2) |
where the elements Hmn are taken row-wise from a Hadamard matrix of order N, and Bm and Ψm are the amplitude and phase of the resultant optical field. Each element Hmn is either −1/2 or +1/2.
To measure the transmission, we displayed binary patterns on the DMD. These patterns consist of 0’s or 1’s, corresponding to the micromirror turned off or on. Each DMD pattern is therefore equal to the combination of the first and subsequent virtual elements, i.e., the resulting electric field is equal to ε1+εm, which automatically defines ε1 as the reference vector. Here, ε1 is simply the resultant vector when all the DMD pixels are turned on, i.e. H1n =1. The measured intensity when the m-th pattern is displayed is then given by
| (3) |
where we have set |B1| =1 and Ψ1=0 without loss of generality. Note that the first two terms are constant, and consequently the measurements can be differentiated by the sign of the third term. This sign depends on the phase angle Ψm, which is measured with respect to the vector ε1. Noting that , the optimized pattern can be obtained by multiplying the measured values of Im by the inverse of the Hadamard matrix, then turning on only the segments that have positive values. This is equivalent to selecting the segments that have phase Φm ∈[−π/2,π/2], measured relative to Ψ1, and therefore interfere constructively at the focus.
So far, we have assumed that a single output mode is measured directly, e.g., by using a photodiode. In our experiments, Im is measured indirectly using an ultrasonic transducer to detect PA signals generated from the target. Nevertheless, since the PA signals are linearly related to the total energy absorbed [10], this procedure is still valid. In this case, the peak-to-peak PA signal amplitude is proportional to the total optical fluence Fm (J/m2) absorbed within the ultrasound detection volume V:
| (4) |
where Fm = ∫ Im(t) dt is integrated over the laser pulse time, x and y are along the transducer’s transverse plane, z is along the light propagation direction, and μa is the absorption coefficient.
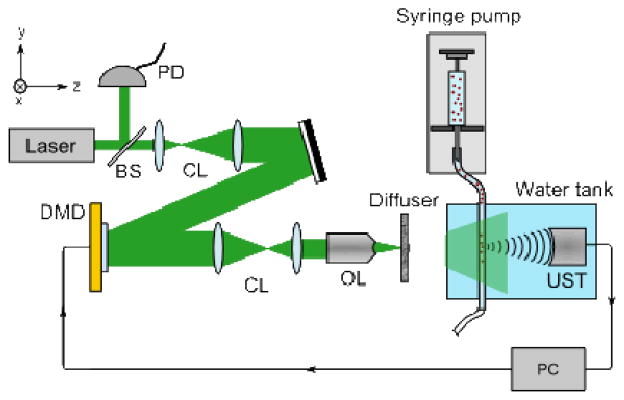
The optical setup of our PAF system is shown schematically in Fig. 1. We used a 523 nm pulsed laser beam (Nd:YLF, EdgeWave, BX-series), with a pulse energy of ~800 μJ, and a repetition rate of 1 kHz. The beam was expanded to ~2 cm in diameter to fill the aperture of the DMD (Texas Instruments, D4100; 1024×768 pixels), giving a pulse energy density of ~200 μJ/cm2 at the DMD surface. We note that this was the strongest pulse energy that could be handled by the DMD before we started to observe malfunctioning pixels. An aperture was also used to block stray uncontrolled light from the DMD. The beam was then reduced to 5 mm and focused on to the sample using a 10× objective lens (NA = 0.25). A small portion of the beam was also directed to a photodiode and used to compensate for pulse-to-pulse energy fluctuations. To mimic a blood vessel within tissue, we placed a silicone tube (Silastic; 1 mm inner diameter) ~14 cm behind a ground-glass diffuser (Thorlabs, DG10-120) as the sample. The tube was submerged in water for acoustic coupling. The PA signal was detected using a 10 MHz ultrasonic transducer (Panametrics, A315S; f# = 2, −6 dB bandwidth = 5.5 MHz), which had a 400 μm transverse focal diameter, measured as the FWHM of the transducer response profile. The speckle size after the diffuser was ~440–660 μm, measured using the autocorrelation of a CCD image of the speckle field [16], giving a single speckle within the ultrasonic focus.
FIG 1.

Schematic representation of the optical system. BS: beam sampler, CL: collimating lenses, DMD: digital micromirror device, OL: 10× objective lens, PC: computer, PD: photodiode, and UST: ultrasonic transducer.
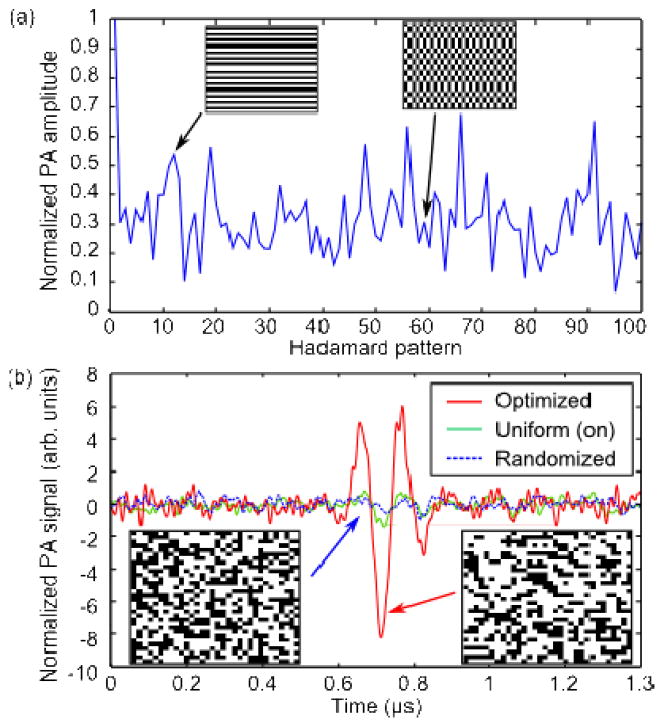
The experiment was carried out in two stages: the optimization as was described previously, and measurement of particle flow. During the optimization stage, we filled the tube with black ink to mimic homogeneous absorption in flowing blood. We divided the DMD into 1024 (32×32) independent segments, with each segment consisting of 32×24 micromirrors. The 1024 patterns required were generated from a Hadamard matrix of the corresponding order. Each pattern was displayed on the DMD, and the resulting PA signals were amplified 100× (Minicircuits, ZFL-500LN), and measured with an oscilloscope (Tektronix, DPO2024). Initially, no PA signal was detected using single-shot measurements, and averaging was required. The PA signal was averaged over 64 acquisitions, increasing the SNR to 3.9. The SNR was measured by calculating the ratio of the PA signal amplitude and the standard deviation of the noise—acquired when no light was present. Fig. 2(a) shows the first 100 PA signal amplitudes along with representative binary patterns. The measured PA signal amplitudes were then inverse Hadamard transformed to calculate the optimal pattern. We compared the PA signal from the optimal pattern with the PA signal generated by turning all the segments on (uniform), and from a randomized pattern with the same number of segments turned on. Note that the randomized pattern generates a PA signal that is ~2× smaller compared to the signal when all the DMD pixels are turned on. As shown in Fig. 2(b), the optimized PA signal amplitude was 14× larger compared to the randomized pattern, and 6.5× larger compared to the uniform pattern. At first glance, this result may appear counter-intuitive; an increase in optical intensity was obtained despite approximately half the micromirrors being turned off in the optimal pattern, resulting in half as much total incident light delivered on the sample. Nevertheless, the intensity was increased because we have selected the segments which added constructively at the transducer focus [14].
FIG 2.
(a) PA signal amplitudes obtained during the measurement stage for the first 100 Hadamard patterns. Insets: 10-th and 59-th patterns (b) The PA signal generated by the optimized pattern (red, solid line) was increased by 14× over the randomized pattern (blue, dotted line), and 6.5× over the uniform pattern (green, solid line). The PA signals were normalized so the randomized signal amplitude is unity. Insets: Patterns displayed on DMD.
The expected intensity increase compared to the randomized pattern can be estimated by [14]
| (5) |
N =1024 in our experiment, and hence, the expected increase was ~163, assuming that only a single output mode was measured. The intensity increase is expected to be reduced proportionally by the number of modes within the detection volume [10]. The lower actual improvement obtained was most likely due to the poor SNR in the measurement stage, as well as uneven DMD illumination (the optical intensity varied by as much as 2× due to the high order laser output modes).
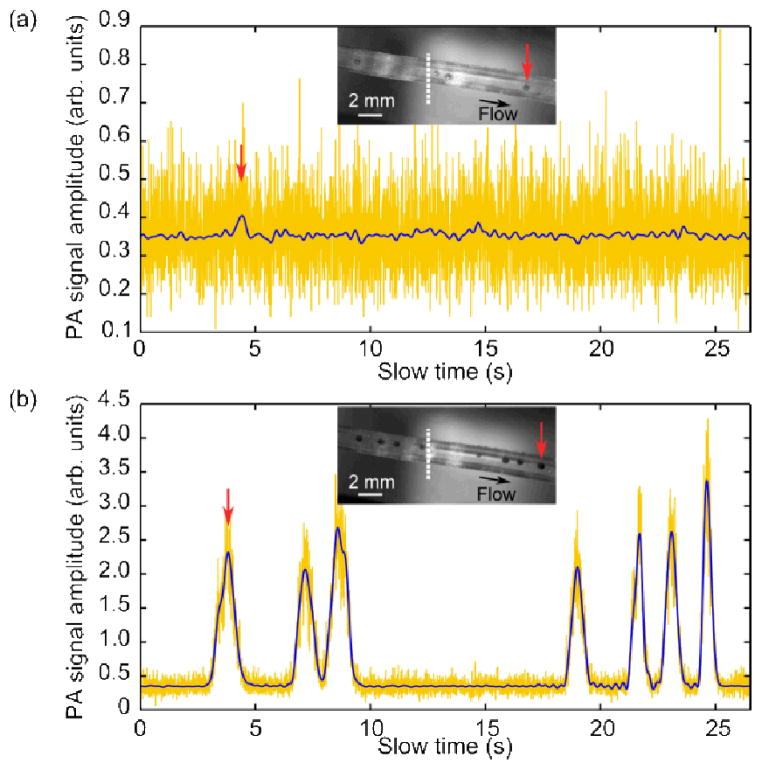
After optimization, the single-shot SNR was increased to ~8, easily sufficient to enable flow measurements. Thus, in the second stage, we replaced the black ink with an aqueous suspension of microspheres (Phosphorex, 1500KR, Red Polystyrene), which had an average diameter of 500 μm (variation ~10%), chosen to match the detection volume. We note that the microspheres were strongly absorbing, and generated broadband PA signals. The flow speed of the suspension through the tube was controlled using a syringe pump (Braintree Scientific, BSP-99M), set between 0.29 and 1.76 mm/s, which is comparable to capillary blood flows [17]. The speed of the particles in the suspension was measured using PA correlation spectroscopy [1]: first, a series of PA signals (A-lines), detected by the ultrasonic transducer as the particles traversed the generated optical focal spot, were amplified 100× as before, then measured using a 12-bit digitizer card (AlazarTech, ATS9350) at a sampling rate of 500 MS/s. Each A-line was recorded from the PA signal generated by a single laser pulse (single-shot) (see Media 1 and 2). The peak-to-peak amplitude of each PA A-line in the series was then calculated and used as one data point of the “slow-time” profile [1,18]. This “slow-time” profile refers to the millisecond-scale measurement time at each laser pulse, as opposed to the fast time, which is the microsecond-scale PA flight time in each A-line. This slow-time profile was then low-pass filtered numerically, with a cutoff frequency of 3 Hz. For comparison, Fig. 3 shows the measured slow-time PA profiles when the syringe pump was set to 0.58 mm/s, and with either the uniformly on or the optimal pattern displayed. As can be seen in Fig. 3(a), even with all the DMD micromirrors turned on, there was insufficient SNR for single-shot measurements. However, as shown in Fig. 3(b), after the optimization, the increased SNR allowed the particles to be clearly detected. We then calculated the normalized autocorrelation function G(τ) of each slow-time profile, which is related to the flow speed by [1]
FIG 3.
Slow-time PA profiles for (a) a uniform pattern (all on) and (b) the optimized pattern displayed on the DMD. The raw single-shot data (yellow) was filtered at 3 Hz (blue). The insets show the particles within the tube (Media 1 and 2, respectively). The position of the transducer focus is indicated by the white, dotted line. The position of the first particle is indicated by the red arrows. Note that the signal in (a) is similar to the noise level in (b).
| (6) |
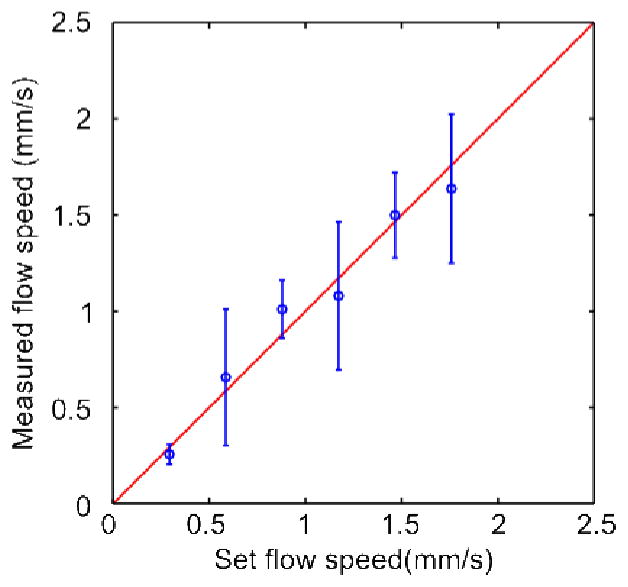
where τ is the slow time, and τf =r0/vf is the decay constant, given by the ratio of the detection spot size r0 and the particle flow speed vf. The detection spot size is given by the convolution of the particle diameter rp and the generated optical spot size, which is assumed to be equal to the full-width at half maximum of the transducer detection sensitivity rUS. To obtain vf, the slow-time profile of each particle was fitted to Eq. (6). As shown in Fig. 4, the measured flow speeds and the preset speeds are in agreement. The variation in the measured speed is mainly due to the variation in particle size. In addition, the larger particles tended to sink and drag along the bottom of the tube.
FIG 4.
Flow speed measured with different settings of the syringe pump, using the optimized DMD pattern. The error bars indicate the standard deviation. The variation is due to different particle sizes. The red line shows the expected relationship between the preset and measured flow speeds.
In conclusion, we have demonstrated that the measurement SNR of PAF can be improved using wavefront shaping techniques. By using binary amplitude masking, an increase in intensity of 14× compared to the initial diffuse illumination was obtained. This intensity increase gave a corresponding increase in measurement SNR, readily allowing single particle flow speeds to be measured. This technique can potentially extend the operational depth of PA flowmetry beyond 1 mm. There are two main challenges that need to be overcome before our technique can be used with real tissue. First, the optimization took ~2 hours, due mainly to the averaging required to obtain the PA signal. Due to this, we used a ground glass diffuser as the scattering medium. However, this is not a fundamental limitation, as the DMD is capable of operating at 22 kHz. Therefore, with sufficient SNR, the measurement time could have been reduced to 47 ms, which is more practical for biological applications. Second, in this experiment, the speckles are relatively large. In deep tissue, the speckle size is comparable to the laser wavelength, giving approximately 0.5 million speckles within the detection volume. State-of-the-art DMDs currently have resolutions of ~2 million pixels and cannot provide adequate control. However, the number of detected (and therefore controlled) speckles could be reduced by using nonlinear PA signals [7] or by filtering the transducer response [19,20].
Acknowledgments
We would like to thank Yong Zhou for experimental assistance, Prof. James Ballard for assistance in proofreading the manuscript. This work was sponsored in part by the National Institutes of Health grants DP1 EB016986 (Director’s Pioneer Award), R01 CA186567 (Director’s Transformative Research Award), R01CA157277, and R01 CA159959. L. V. Wang has a financial interest in Microphotoacoustics, Inc. and Endra, Inc., which, however, did not support this work.
References
- 1.Chen SL, Xie Z, Carson PL, Wang X, Guo LJ. In vivo flow speed measurement of capillaries by photoacoustic correlation spectroscopy. Opt Lett. 2011;36:4017. doi: 10.1364/OL.36.004017. [DOI] [PMC free article] [PubMed] [Google Scholar]
- 2.Galanzha EI, Shashkov EV, Kelly T, Kim JW, Yang L, Zharov VP. In vivo magnetic enrichment and multiplex photoacoustic detection of circulating tumour cells. Nat Nanotechnol. 2009;4:855–860. doi: 10.1038/nnano.2009.333. [DOI] [PMC free article] [PubMed] [Google Scholar]
- 3.Wang LV, Hu S. Photoacoustic Tomography: In Vivo Imaging from Organelles to Organs. Science. 2012;335:1458–1462. doi: 10.1126/science.1216210. [DOI] [PMC free article] [PubMed] [Google Scholar]
- 4.Vellekoop IM, Mosk AP. Focusing coherent light through opaque strongly scattering media. Opt Lett. 2007;32:2309–2311. doi: 10.1364/ol.32.002309. [DOI] [PubMed] [Google Scholar]
- 5.Vellekoop IM, Mosk AP. Phase control algorithms for focusing light through turbid media. Opt Commun. 2008;281:3071–3080. [Google Scholar]
- 6.Conkey DB, Brown AN, Caravaca-Aguirre AM, Piestun R. Genetic algorithm optimization for focusing through turbid media in noisy environments. Opt Express. 2012;20:4840–4849. doi: 10.1364/OE.20.004840. [DOI] [PubMed] [Google Scholar]
- 7.Tay JW, Lai P, Suzuki Y, Wang LV. Ultrasonically encoded wavefront shaping for focusing into random media. Sci Rep. 2014;4 doi: 10.1038/srep03918. [DOI] [PMC free article] [PubMed] [Google Scholar]
- 8.Popoff SM, Lerosey G, Carminati R, Fink M, Boccara AC, Gigan S. Measuring the Transmission Matrix in Optics: An Approach to the Study and Control of Light Propagation in Disordered Media. Phys Rev Lett. 2010;104:100601. doi: 10.1103/PhysRevLett.104.100601. [DOI] [PubMed] [Google Scholar]
- 9.Conkey DB, Caravaca-Aguirre AM, Piestun R. High-speed scattering medium characterization with application to focusing light through turbid media. Opt Express. 2012;20:1733–1740. doi: 10.1364/OE.20.001733. [DOI] [PubMed] [Google Scholar]
- 10.Chaigne T, Katz O, Boccara AC, Fink M, Bossy E, Gigan S. Controlling light in scattering media non-invasively using the photoacoustic transmission matrix. Nat Photonics. 2014;8:58–64. [Google Scholar]
- 11.Kong F, Silverman RH, Liu L, Chitnis PV, Lee KK, Chen YC. Photoacoustic-guided convergence of light through optically diffusive media. Opt Lett. 2011;36:2053–2055. doi: 10.1364/OL.36.002053. [DOI] [PMC free article] [PubMed] [Google Scholar]
- 12.Lai P, Wang L, Tay JW, Wang LV. Nonlinear photoacoustic wavefront shaping (PAWS) for single speckle-grain optical focusing in scattering media. 2014 ArXiv14020816 Phys. [Google Scholar]
- 13.Lev A, Sfez B. In vivo demonstration of the ultrasound-modulated light technique. J Opt Soc Am A. 2003;20:2347–2354. doi: 10.1364/josaa.20.002347. [DOI] [PubMed] [Google Scholar]
- 14.Akbulut D, Huisman TJ, van Putten EG, Vos WL, Mosk AP. Focusing light through random photonic media by binary amplitude modulation. Opt Express. 2011;19:4017–4029. doi: 10.1364/OE.19.004017. [DOI] [PubMed] [Google Scholar]
- 15.Herbert E, Pernot M, Montaldo G, Fink M, Tanter M. Energy-based adaptive focusing of waves: application to noninvasive aberration correction of ultrasonic wavefields. IEEE Trans Ultrason Ferroelectr Freq Control. 2009;56:2388–2399. doi: 10.1109/TUFFc.2009.1327. [DOI] [PMC free article] [PubMed] [Google Scholar]
- 16.Piederrière Y, Cariou J, Guern Y, Le Jeune B, Le Brun G, Lotrian J. Scattering through fluids: speckle size measurement and Monte Carlo simulations close to and into the multiple scattering. Opt Express. 2004;12:176–188. doi: 10.1364/opex.12.000176. [DOI] [PubMed] [Google Scholar]
- 17.Stücker M, Baier V, Reuther T, Hoffmann K, Kellam K, Altmeyer P. Capillary Blood Cell Velocity in Human Skin Capillaries Located Perpendicularly to the Skin Surface: Measured by a New Laser Doppler Anemometer. Microvasc Res. 1996;52:188–192. doi: 10.1006/mvre.1996.0054. [DOI] [PubMed] [Google Scholar]
- 18.Liang J, Zhou Y, Maslov KI, Wang LV. Cross-correlation-based transverse flow measurements using optical resolution photoacoustic microscopy with a digital micromirror device. J Biomed Opt. 2013;18:096004–096004. doi: 10.1117/1.JBO.18.9.096004. [DOI] [PMC free article] [PubMed] [Google Scholar]
- 19.Conkey DB, Caravaca-Aguirre AM, Dove JD, Ju H, Murray TW, Piestun R. Super-resolution photoacoustic imaging through a scattering wall. 2013 doi: 10.1038/ncomms8902. ArXiv13105736 Phys. [DOI] [PubMed] [Google Scholar]
- 20.Chaigne T, Katz O, Gateau J, Boccara C, Gigan S, Bossy E. Improving photoacoustic-guided focusing in scattering media by spectrally filtered detection. 2013 doi: 10.1364/OL.39.006054. ArXiv:1310.7535 Phys. [DOI] [PubMed] [Google Scholar]


