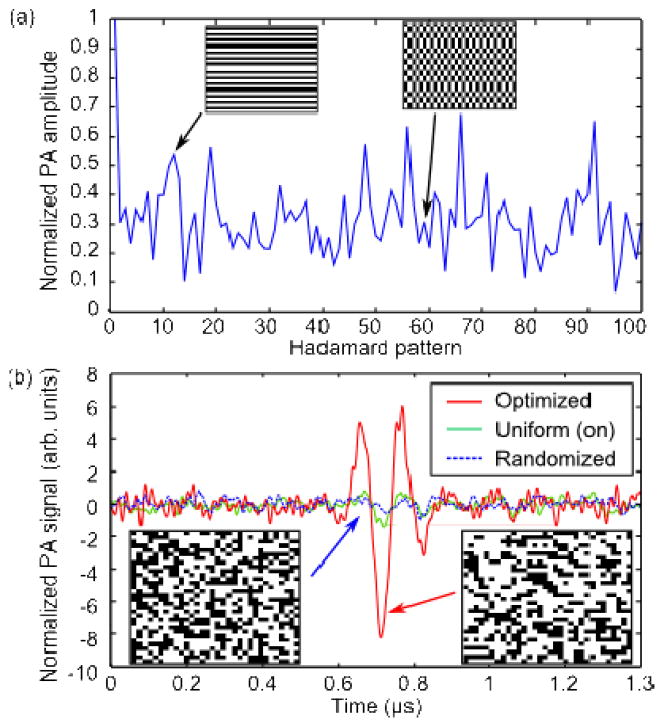
FIG 2.
(a) PA signal amplitudes obtained during the measurement stage for the first 100 Hadamard patterns. Insets: 10-th and 59-th patterns (b) The PA signal generated by the optimized pattern (red, solid line) was increased by 14× over the randomized pattern (blue, dotted line), and 6.5× over the uniform pattern (green, solid line). The PA signals were normalized so the randomized signal amplitude is unity. Insets: Patterns displayed on DMD.

