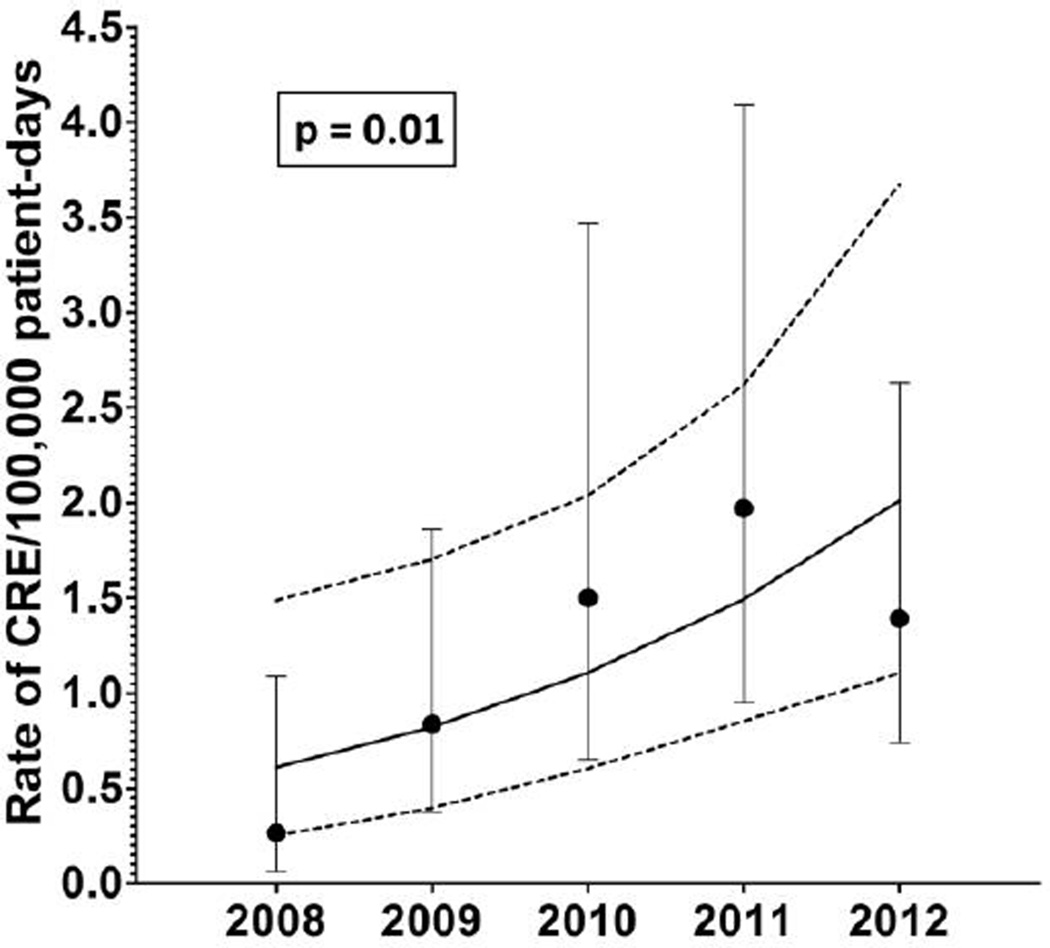
Figure 1.
Trend analysis for carbapenem-resistant Enterobacteriaceae (CRE) detection per 100,000 patient-days from the Duke Infection Control Outreach Network. Mean rates of CRE detection per 100,000 patient-days per year are indicated by black dots, and 95% confidence intervals (CIs) are indicated with bars. Trend line (solid line) and 95% CIs for the trend line (dashed lines) were constructed using Poisson regression while controlling for clustering by hospital. The increase in CRE detection over this period is statistically significant (P = .01).

