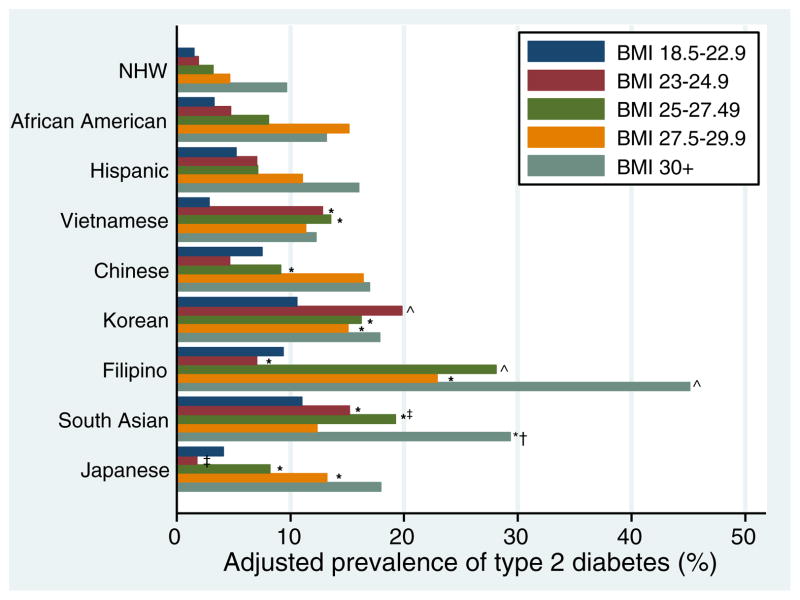
Fig. 2.
Weighted age, sex and nativity adjusted prevalence of type 2 diabetes by body mass index (BMI, kg/m2) strata for each racial/ethnic group from the 2009 California Health Interview Survey. BMI strata incorporate cut points from the standard and World Health Organization (WHO) Asian BMI scale. The prevalence of diabetes in each BMI strata in Asian subgroups was compared to non-Hispanic Whites (NHW) in the same BMI strata. Statistically significant differences (p < 0.05) are indicated as follows: *versus NHW, †versus African American, ‡versus Hispanic and ^versus NHW, African American and Hispanic.

