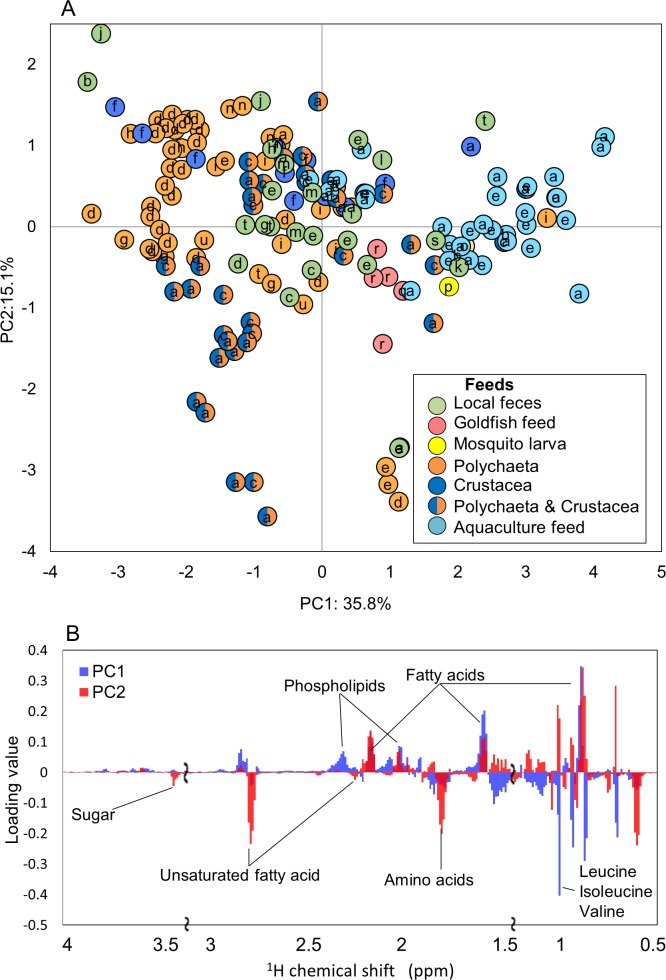
Figure 5. Metabolic variations based on 1H NMR profiling of various fishes evaluated by PCA.
(A) PCA score plot for 1H NMR profiles (k = 793, R2X = 0.268, R2Y = 0.181, Q2 = 0.201) of fish feces was computed from 169 samples from 21 species. Letters (a–u) represent fishes listed in Table S2. (B) PCA loading plots on 1H NMR profiles.

