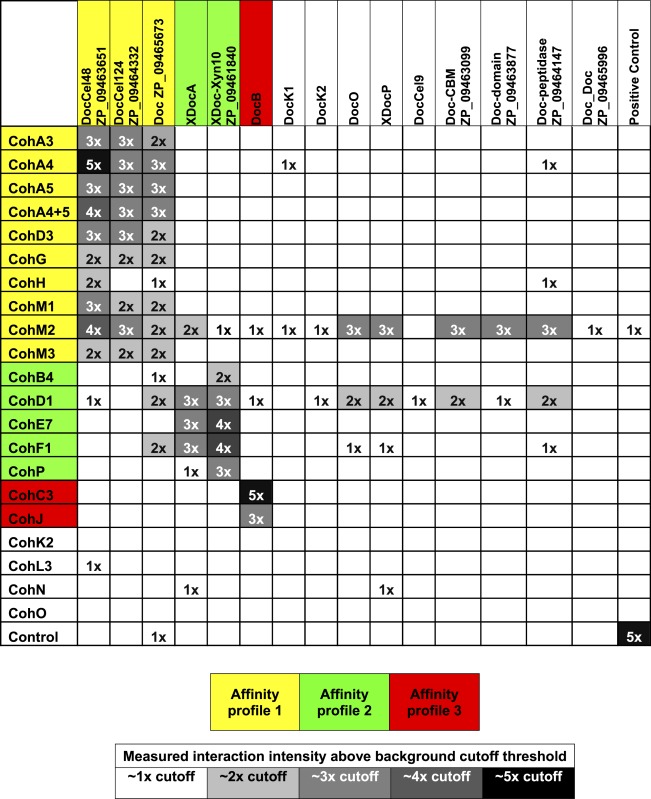
Table 1. Summary of A. cellulolyticus cohesin–dockerin interactions.
Interaction matrix showing the binding intensities of the complete cohesin–dockerin library with cohesins and dockerins presented by rows and columns, respectively. The protein–protein interactions are color coded based on their measured interaction above the background cutoff threshold as indicated in the gray scale key, for example 3x denotes an interaction 3-times over the threshold interaction level. The positive control interaction is between a C. thermocellum cohesin and dockerin (from the Cel48 cellobiohydrolase).

|
