
Fig. 4.
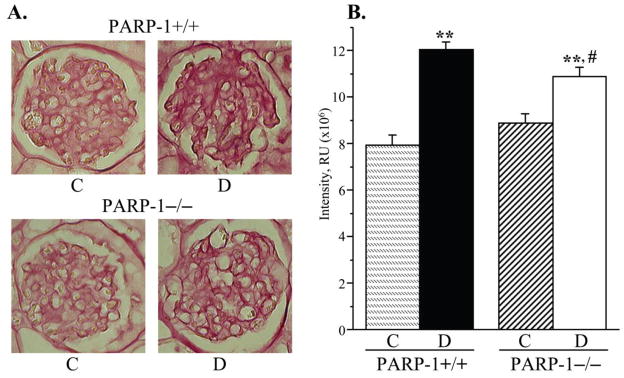
A) Representative microphotographs and B) color intensities of PAS-positive substance stainings in the renal cortex in control and diabetic wild-type and poly(ADP-ribose)polymerase-1-deficient mice. C – control; D – diabetic, PARP-1 – poly(ADP-ribose) polymerase-1. Magnification x 400. Mean ± SEM, n = 10 per group. ** - p < 0.01 vs corresponding non-diabetic groups; # - p < 0.05 vs diabetic wild-type mice.