
Fig. 5.
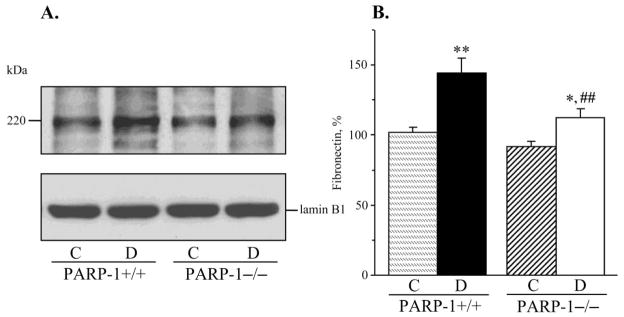
A) Representative Western blot analysis of renal cortex fibronectin and B) fibronectin content (densitometry), in control and diabetic wild-type and poly(ADP-ribose)polymerase-1-deficient mice. C – control; D – diabetic, PARP-1 – poly(ADP-ribose) polymerase-1. Mean ± SEM, n = 10–13 per group. *, ** - p < 0.05 and < 0.01 vs corresponding non-diabetic groups; ## - p < 0.01 vs diabetic wild-type mice.