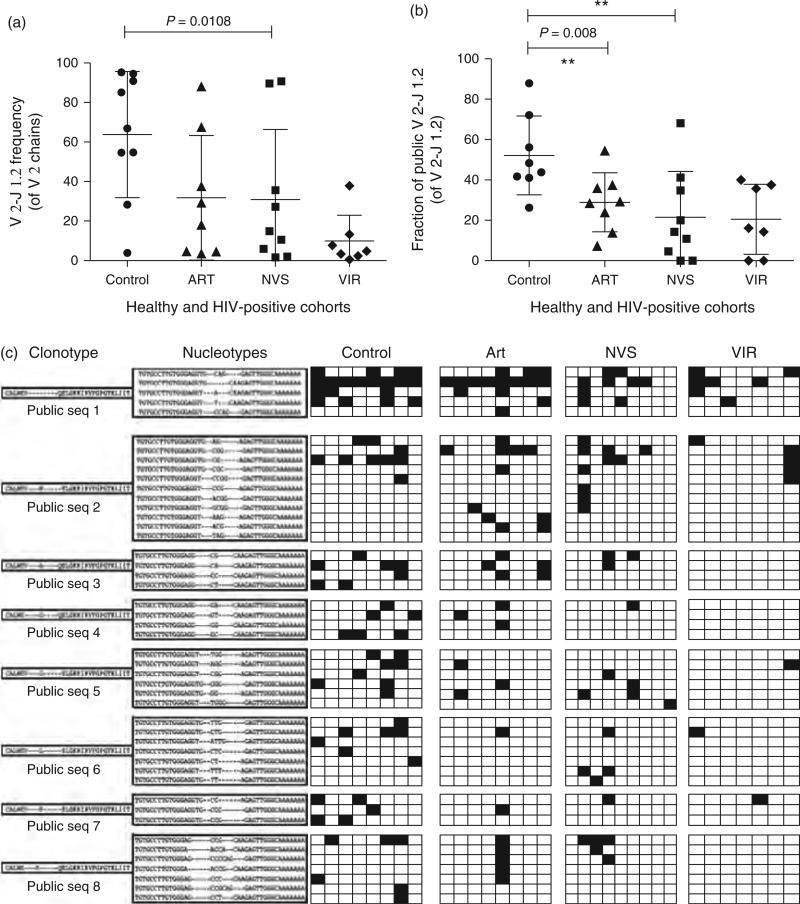
Fig. 1. HIV infection depletes circulating Vγ2-Jγ1.2Vδ2 T cells.
(a) The fraction of Vγ2 chains expressing Jγ1.2 segment is lowest for the VIR group. The fraction of chains expressing Jγ1.2 was calculated and plotted for the four groups (mean + SD). On average, approximately 60% of Jγ2 chains expressed the Jγ1.2 segment in healthy controls, whereas only approximately 10% Jγ2 chains were Jγ1.2 in VIR. For NVS and ART groups this number was approximately 30%. (b) The fraction of Vγ2-Jγ1.2 chains expressing public Jγ1.2 clonotype is lowest for the VIR group. Public clonotypes were identified as aa sequences present in more than one patient in the control group, and these sequences were scored for their presence in HIV-positive groups. For control group, approximately 52% of Vγ2-Jγ1.2 chains were found in two or more donors, whereas approximately 20% of Vγ2-Jγ1.2 chains were public for VIR and NVS groups. ART group had approximately 30% public Vγ2-Jγ1.2 chain. For each panel horizontal lines represent mean values. Statistical comparisons used Kruskal–Wallis test; P values less than 0.05 were considered significant. (c) Clonotype and nucleotype abundance for the most common public Vγ2-Jγ1.2 chains in control, ART, NVS, and VIR groups. The eight most common public clonotypes (PubSeq 1–8) are listed along with all their nucleotypes found in this study. Vertical columns are grouped into control, ART, NVS, and VIR groups as described in the text. Each individual column represents sequencing data for an individual patient. A shaded box indicates that nucleotype was present in the set of TCR-Vγ2 sequences from the individual patient or control. ART, antiretroviral therapy; NVS, natural virus suppressor; TCR, T-cell receptor; VIR, viremic and not receiving therapy.

