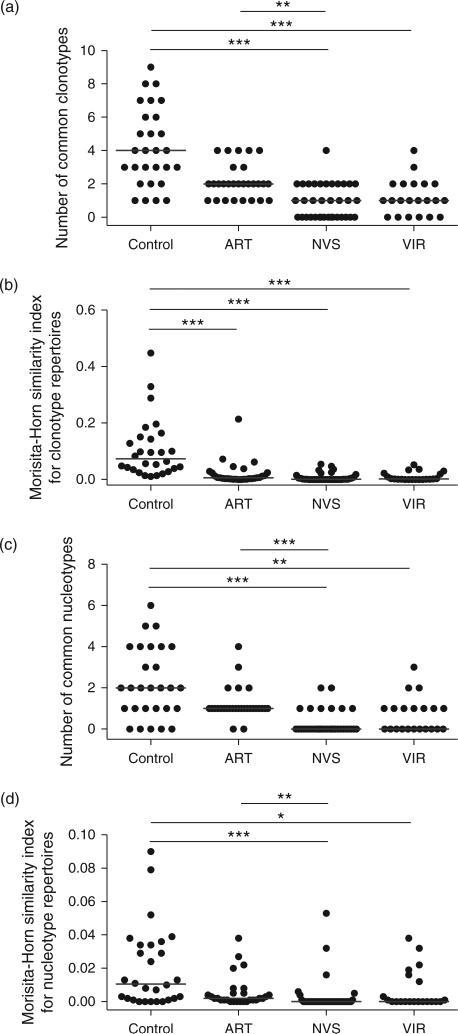
Fig. 2. Similarity analysis between the TCR-Vγ2 repertoires of pairs of individuals within each group.
The number of clonotypes (a) or nucleotypes (c) common between individual repertoires and the Morisita-Horn similarity indices for clonotype (b) and nucleotype (d) repertoires were estimated for a sample size of 98 TCR-Vγ2 sequences per individual repertoire. Horizontal lines represent the median similarity values per group and asterisks show P < 0.0005 (***), (P < 0.005 (**), or P < 0.05 (*). Statistical comparisons were made using a Kruskal–Wallis test and Dunn's multiple comparison post-tests. In terms of common nucleotypes (c) or similarity index for nucleotype repertoire (d), control and ART groups were not different at P < 0.05. ART, antiretroviral therapy; TCR, T-cell receptor.

