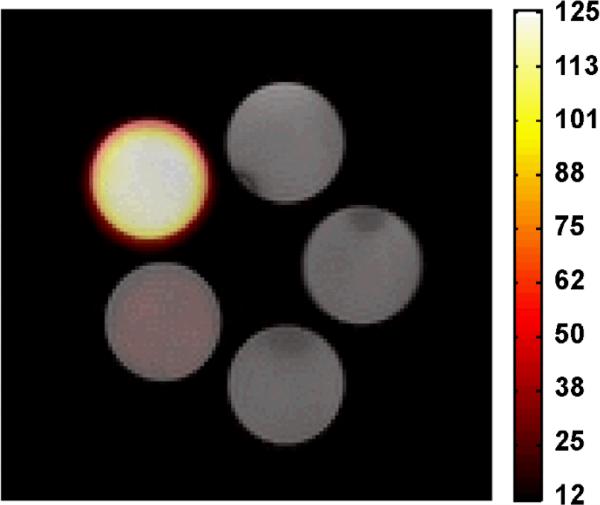
Figure 3.
19F-MR phantom images superimposed upon 1H MR images of mPEG1k-OPFtBTRI polymer solutions in Milipore water, with 25 min scan time, at 4.7 TF and scaled according to SNR. From top center moving counter clock-wise: Blank (0 mM), 5 mM, 1 mM, 0.1 mM, and 0.01 mM. The 5 mM phantom shows strong signal while 1 mM demonstrates the limit of detectability.

