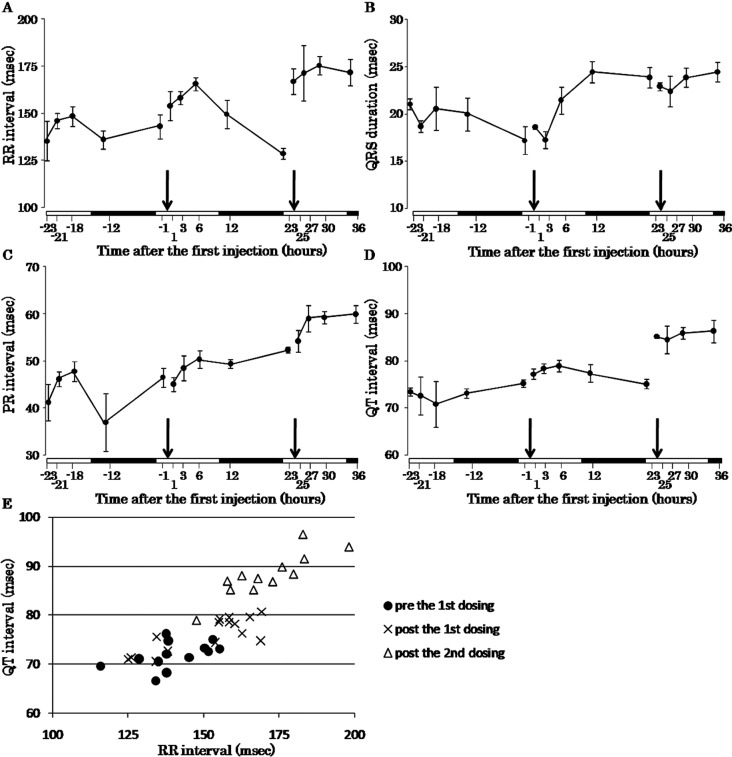
Fig. 1.
Time-response curves of the RR interval (A), QRS duration (B), PR interval (C), QT interval (D) and QT-RR plot (E) before and after injections of colchicine. Arrows indicate time points of colchicine injection. White bars and filled bars on horizontal axes indicate the light period and dark period, respectively. Error bars indicate the SE.

