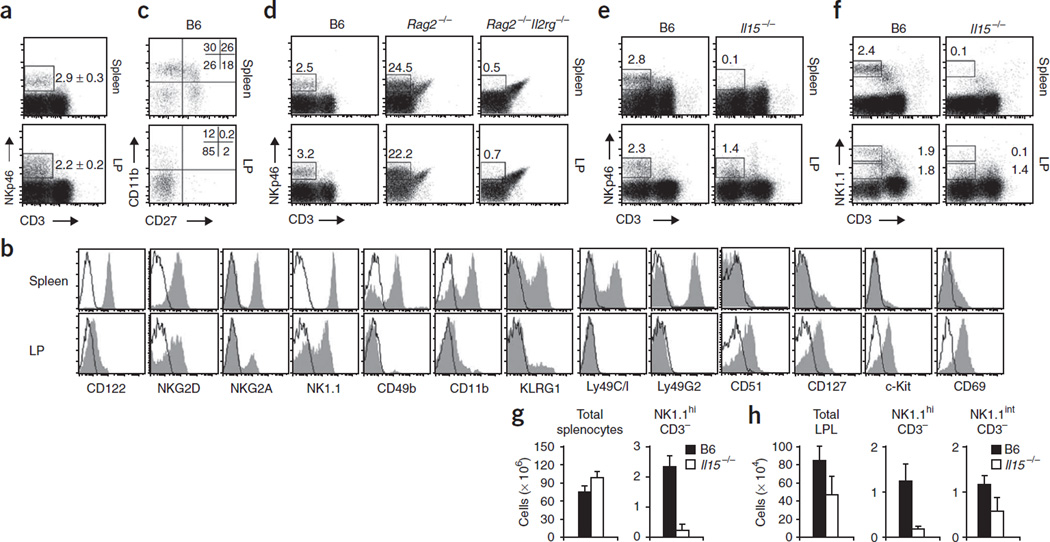
Figure 1.
Lamina propria NKp46+ cells have an immature phenotype. (a,b) Flow cytometry of lamina propria (LP) lymphocytes from the small intestine and spleen cells stained with anti-CD3 and anti-NKp46. (a) Numbers adjacent to outlined areas indicate percent NKp46+CD3− cells (mean ± s.e.m.). (b) Gating on NKp46+CD3− cells: filled histograms, specific staining (antibodies to markers below plots); open histograms, isotype-matched control antibody. Data are representative of at least eight independent experiments. (c) Flow cytometry of splenocytes and lamina propria cells stained with anti-NKp46, anti-CD3, anti-CD11b and anti-CD27, gated on NKp46+CD3− cells. Numbers in quadrants indicate percent cells in each. Data are representative of three independent experiments. (d) Flow cytometry of lamina propria cells and splenocytes (mouse strains, above plots) stained with anti-NKp46 and anti-CD3. Numbers above outlined areas indicate percent NKp46+CD3− cells. Data are representative of three independent experiments. (e,f) Flow cytometry of B6 and Il15−/− lamina propria cells stained with anti-CD3 and anti-NKp46 (e) or anti-NK1.1 (f). Numbers adjacent to outlined areas indicate percent cells in gate. Data are representative of four independent experiments. (g,h) Absolute numbers of various cell populations (above graphs) in the spleen (g) or intestinal lamina propria (h). LPL, lamina propria lymphocytes. Data are representative of three independent experiments (error bars, s.d.; n = 6 mice).

