
Figure 1.
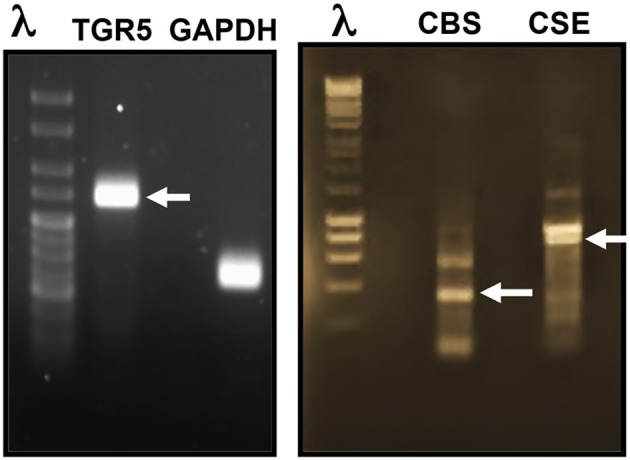
Expression of TGR5, CBS, and CSE in STC-1 cells. RT-PCR analysis of mRNA using specific primers showed amplification of PCR products of predicted size for TGR5 (269 bp), CBS (345 bp), and CSE (851 bp).
Official websites use .gov
A
.gov website belongs to an official
government organization in the United States.
Secure .gov websites use HTTPS
A lock (
) or https:// means you've safely
connected to the .gov website. Share sensitive
information only on official, secure websites.
Expression of TGR5, CBS, and CSE in STC-1 cells. RT-PCR analysis of mRNA using specific primers showed amplification of PCR products of predicted size for TGR5 (269 bp), CBS (345 bp), and CSE (851 bp).