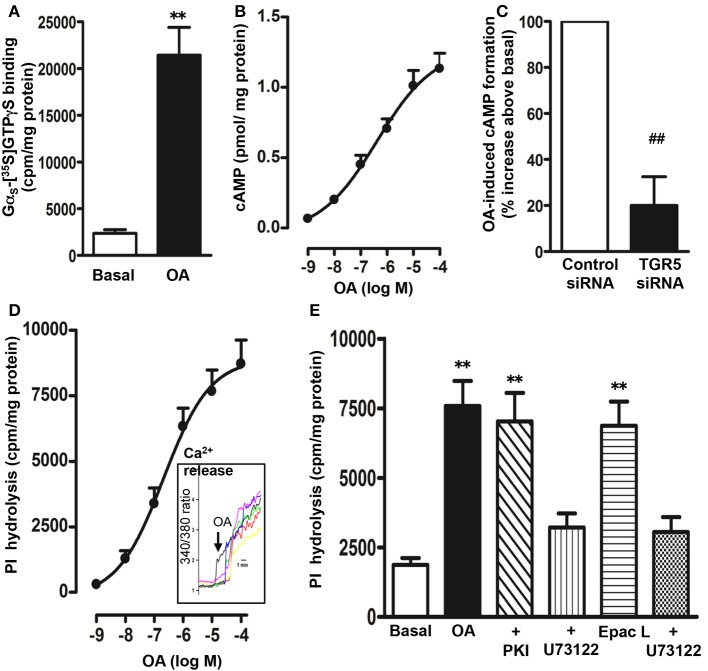
Figure 3.
Signaling pathways activated by OA. (A) Selective activation of Gs by OA. Membranes were incubated with [35S]GTPγS in the presence or absence of OA (10 μM) for 20 min. Aliquots were added to wells pre-coated with antibodies to Gαs, Gαq, Gαi1, Gαi2, and Gαi3 for 2 h and the bound radioactivity was measured. An increase in the binding of [35S]GTPγS.Gα reflects activation of G protein. A significant increase in the binding of [35S]GTPγS.Gα complexes was obtained to wells coated with Gαs antibody only. No significant increase in the binding was obtained to wells coated with Gαi1 (5 ± 7% increase), Gαi2 (3 ± 8 increase), Gαi3 (6 ± 9% increase), or Gαq (10 ± 15% increase) antibody. Values are mean ± s.e.m. of 4 experiments. **p < 0.001 vs. basal. (B) Stimulation of cAMP by OA. Cells were treated with different concentrations of OA for 5 min in the presence of IBMX (10 μM) and cAMP formation was measured by radioimmunoassay. Results are expressed as pmol/mg protein above basal levels (0.054 ± 0.008 pmol/mg protein). OA caused an increase in cAMP levels in a concentration-dependent manner. Values are mean ± s.e.m. of 3 experiments. (C) TGR5-mediated increase in cAMP by OA. Cells transfected with control siRNA or TGR5-specific siRNA were treated with OA (10 μM) for 5 min and cAMP formation was measured by radioimmunoassay. Suppression of TGR5 expression by TGR5 siRNA was confirmed by western blot analysis. Basal level of cAMP was similar in cells transfected with control siRNA (0.051 ± 0.007 pmol/mg protein) and or TGR5 siRNA (0.049 ± 0.008 pmol/mg protein). OA induced a significant increase in cAMP levels (1.12 ± 0.08 pmol/mg protein) in control cells, but not in cells transfected with TGR5 siRNA. Results are expressed as percent of response. Values are mean ± s.e.m. of 3 experiments. ##p < 0.001 significant inhibition of cAMP response compared to cells transfected with control siRNA. (D,E) Stimulation of PI hydrolysis and Ca2+ release by OA and 8-pCPT-2′-O-Me-cAMP (Epac ligand). Cells labeled with myo-[3H]inositol were treated with different concentrations of OA and PI hydrolysis was measured (D). Cells were incubated with the cAMP analog that selectively activates Epac, 8-pCPT-2′-O-Me-cAMP (10 μM) or OA (10 μM) in the presence or absence of inhibitors of PI hydrolysis (U73122, 10 μM) or PKA (myristoylated PKI, 1 μM) (E). PI hydrolysis was measured by ion exchange chromatography as increase in water soluble inositol formation. Results are expressed as cpm/mg protein above basal levels (1856 ± 302 cpm/mg protein). Treatment of cells with PKI (1985 ± 402 cpm/mg protein) or U73122 (1685 ± 293 cpm/mg protein) alone had no significant effect on basal PI hydrolysis. Values are mean ± s.e.m. of 4 experiments. **p < 0.001 vs. basal. (D) Inset: Increase in intracellular Ca2+ monitored in cells after loading the monolayers with Fura-2 AM. Increase in Ca2+ is represented in the figure as increase in 340/380 ratio.

