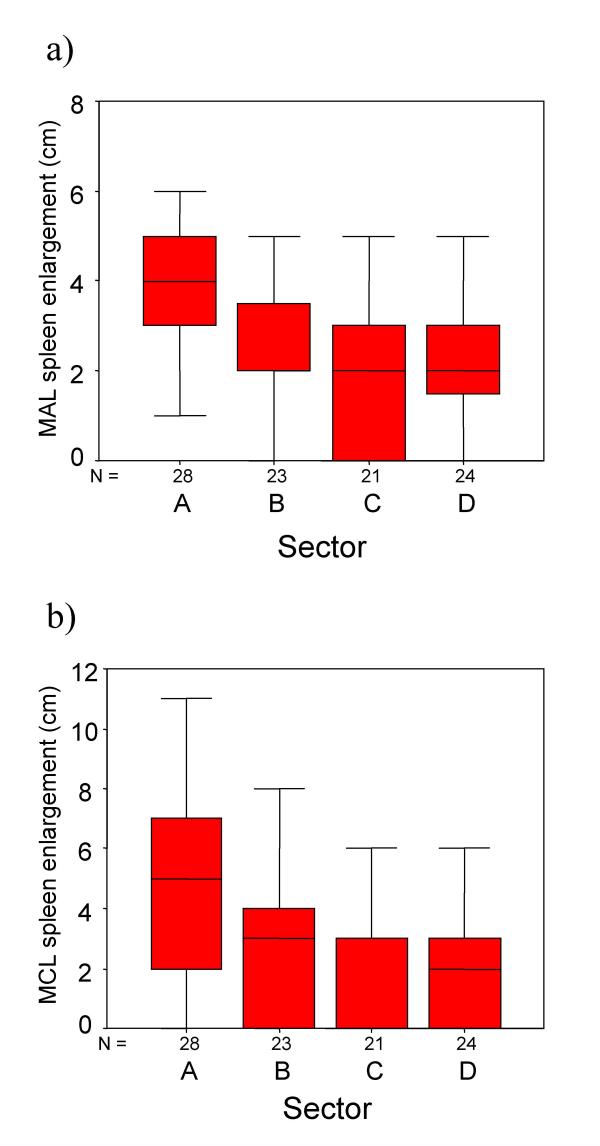
Figure 5.

Box and whisker plots illustrating variation in the degree of splenomegaly along the mid axillary line (Figure 5a) and along the mid clavicular line (Figure 5b). Each plot represents data from one sector corresponding to variation in egg counts and IgG3 responses to P. falciparum schizont antigen.
