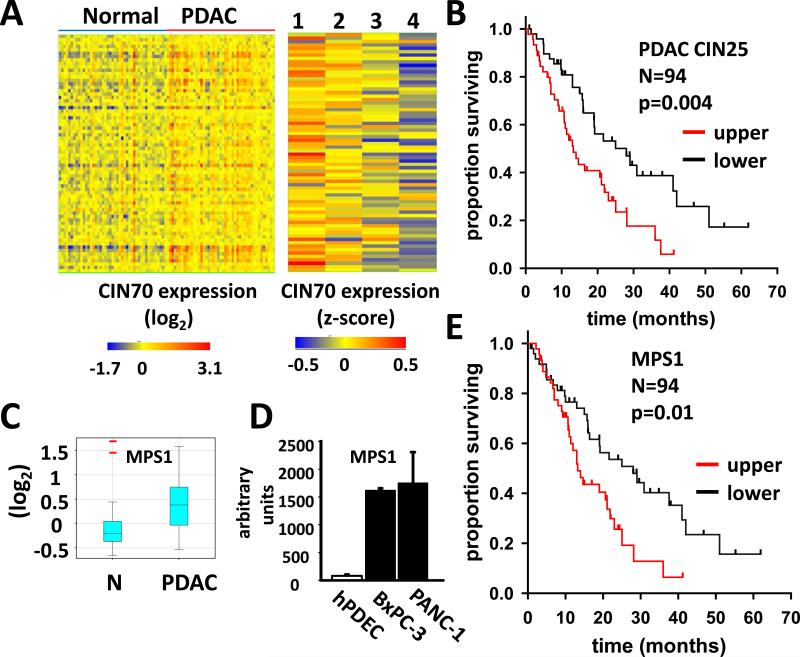
Figure 1. CIN70 gene expression predicts PDAC patient survival.
A. Left panel Matrix of CIN70 gene expression in 45 matched pairs of normal pancreas and resected PDAC tissue. Rows and columns represent genes and samples, respectively. Right panel CIN70 expression in 59 PDAC patients segregated by survival quartile (detailed in text): 1, n=15: median survival 3.8 months; 2, n=17: median survival 10 months; 3, n= 12: median survival 16 months; 4, n=15: median survival 28 months. B. Survival analysis of 94 PDAC patients segregated by the PDAC CIN25 score. Upper and lower represent patients in the respective halves of the PDAC CIN25 score distribution. Upper: median survival 28 months. Lower: median survival 13.2 months. P value refers to log-rank test comparing survival curves. C. Box whisker plot of MPS1 expression in 45 matched pairs of normal (N) and PDAC tissue samples. Central band and lower and upper box limits denote median, first and third quartiles, respectively. Whiskers denote data within 1.5 interquartiles of upper and lower box limits. Red bars indicate outliers. D. MPS1 expression derived from affymetrix gene expression microarray analysis of primary human pancreatic ductal epithelial cells (hPDEC), BxPC-3 and PANC-1 cell lines. E. Survival analysis of 94 PDAC patient samples segregated by MPS1 expression. Upper and lower represent patients in the respective halves of the MPS1 expression distribution. Upper: median survival 28 months. Lower: median survival 13.2 months.

