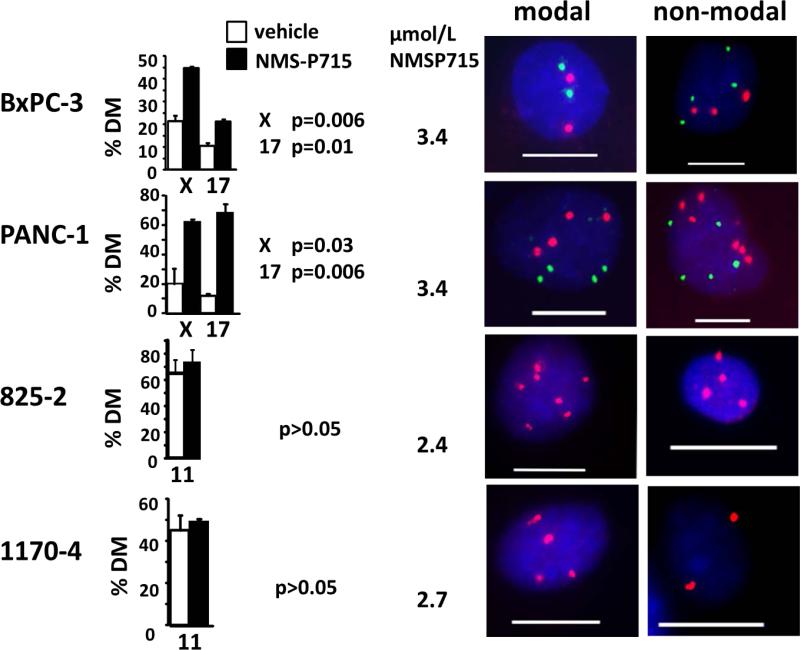
Figure 3. Elevated CIN in PDAC cells treated with the MPS1 inhibitor, NMS-P715.
FISH analysis with X chromosome (red) and chromosome 17 (green) centromeric probes in human BxPC3 or PANC-1 cells or a chromosome 11 probe (red) in mouse KRC cells (825-2 and 1170-4) after treatment with NMS-P715. Drug concentrations approximated preliminary IC50 values (data not shown). Cells were harvested after 48h (BxPC-3 and PANC-1) or 72h (825-2 and 1170-4). Percentage of cells exhibiting deviation from the modal chromosome number (%MD) provides an indirect measure of the CIN rate. Representative images of cells exhibiting either modal or non-modal signal numbers for each cell line are shown. Scale bar =10 μm. The modal chromosome numbers were: 2 for chromosomes X and 17 in BXPC-3 cells; 4 for chromosomes X and 17 in PANC-1 cells; 7 for chromosome 11 in 825-2 cells and 4 for chromosome 11 in 1170-4 cells. Significance was measured using a t-test.

