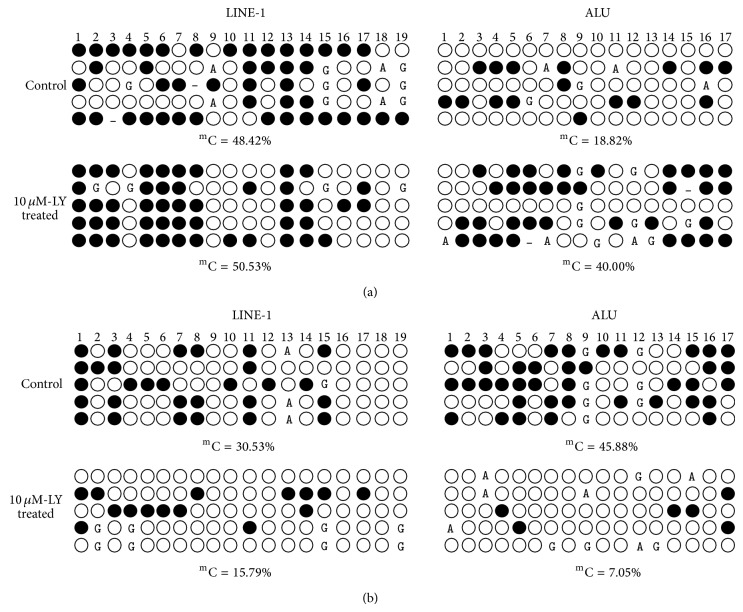
Figure 4.
Effects of lycopene treatment on DNA methylation of LINE-1 and ALU elements in PCa cells. (a) Methylated cytosine in LINE-1 and ALU of lycopene treated PC-3 and control cells. (b) Methylated cytosine in LINE-1 and ALU of lycopene treated LNCaP and control cells. Each row of circles represents a single cloned allele (five clones per cell line). Filled and open circles indicate methylated and unmethylated cytosines, respectively.

