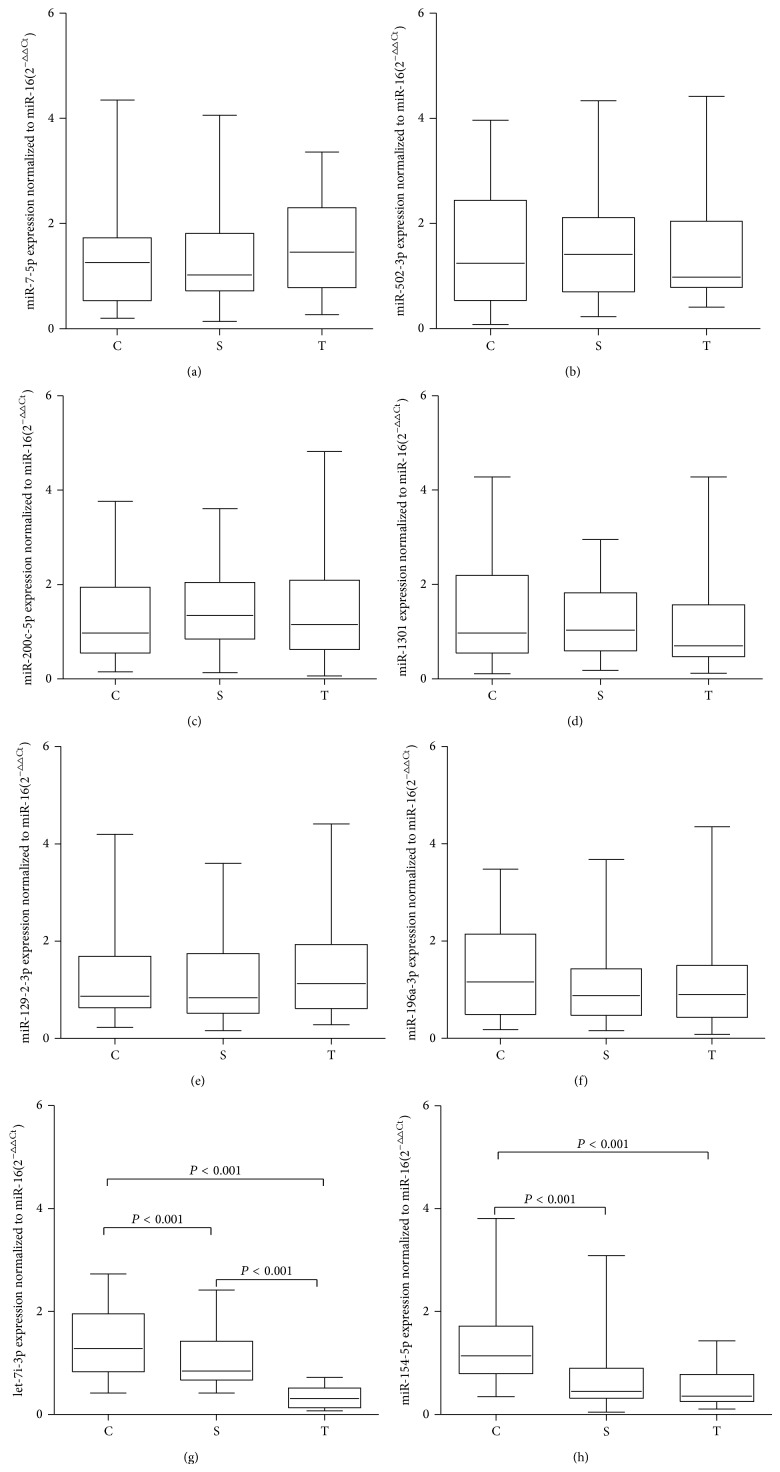
Figure 3.
Expression levels of candidate miRNAs in the sera of nonsmoker controls (C), smokers (S), and lung-cancer patients (T). Box plots of the levels of miR-7-5p (a), miR-502-3p (b), miR-200c-3p (c), miR-1301 (d), miR-129-2-3p (e), miR-196a-3p (f), let-7i-3p (g), and miR-154-5p (h) in the sera of the nonsmoker controls (n = 30), smokers (n = 30), and lung-cancer patients (n = 30). The expression levels of the miRNAs are relative to the average levels of the controls and are normalized to miR-16. Statistically significant differences were analyzed with the Kruskal-Wallis test. The upper and lower limits of the boxes and the lines across the boxes indicate the 75th and 25th percentiles and the median, respectively.

