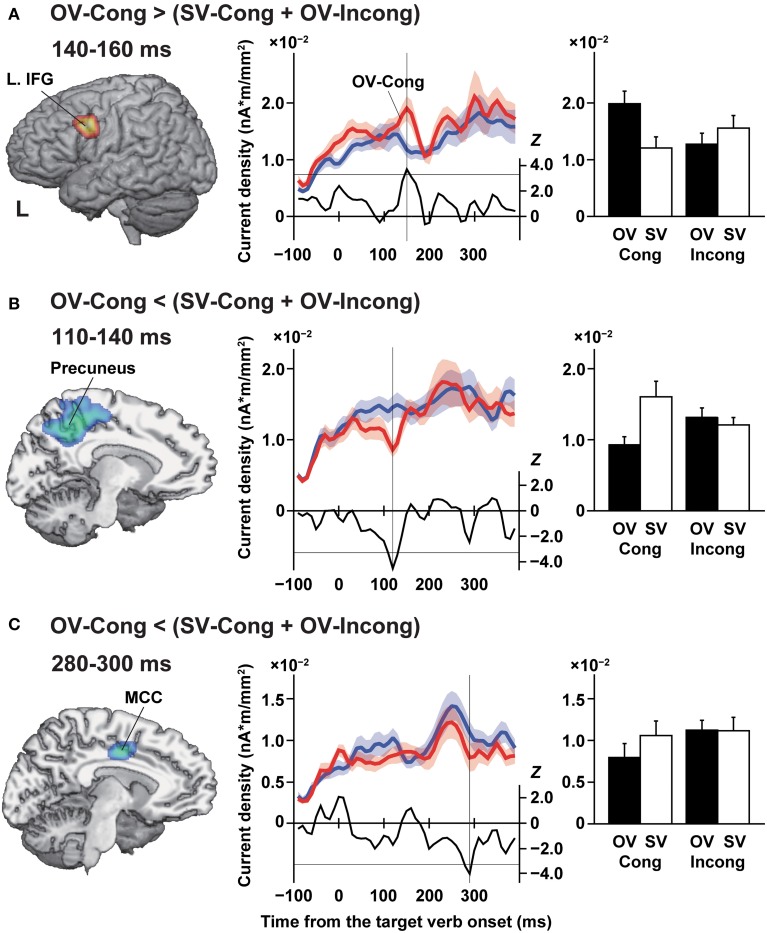
Figure 3.
Selective changes in cortical responses under the OV-Cong condition. The left panels show t-maps on the transformed standard brain (Pcorr = 0.05, false discovery rate). The middle panels show temporal changes of the current density, averaged within each significant cluster. The red and blue line graphs show the current density for the OV-Cong and (SV-Cong + OV-Incong) conditions, respectively (mean ± s.e.m., n = 15). The black line graphs plotted for each temporal bin show temporal changes in the Z values of these comparisons [positive for OV-Cong > (SV-Cong + OV-Incong)]. The horizontal black lines at Z = ± 3.3 denote the selection criteria of patches (uncorrected P = 0.001, paired t-test), and the vertical black lines denote temporal bins, when significant responses were observed (e.g., 150 ms for a bin of 140–160 ms). The right panels show histograms for the current density under each of four conditions (i.e., OV-Cong, SV-Cong, OV-Incong, and SV-Incong). (A) Significantly increased responses under the OV-Cong condition observed in the left inferior frontal gyrus (L. IFG) at 140–160 ms. The left lateral side is shown. (B) Significantly reduced responses under the OV-Cong condition observed in the precuneus at 110–140 ms. A para-sagittal section at x = −10 is shown. (C) Significantly reduced responses under the OV-Cong condition observed in the midcingulate cortex (MCC) at 280–300 ms. A para-sagittal section at x = −6 is shown.

