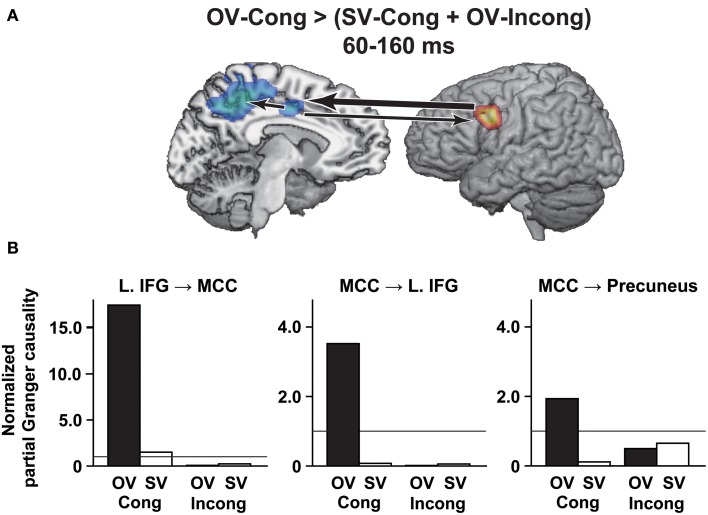
Figure 4.
Selective changes in partial Granger causalities under the OV-Cong condition. Significant differences in causalities (Pcorr = 0.05, false discovery rate) are schematically shown with arrows between clusters on the transformed standard brain. (A) A significant difference of OV-Cong > (SV-Cong + OV-Incong) in causalities at 60–160 ms, observed between the L. IFG and MCC, as well as from the MCC to the precuneus. A thick arrow denotes the strongest causality among these regions. (B) Histograms for the normalized partial Granger causalities shown in (A). Horizontal lines at 1.0 in the histograms denote the significance of differences from zero in the normalized partial Granger causalities (Pcorr = 0.05, false discovery rate).

