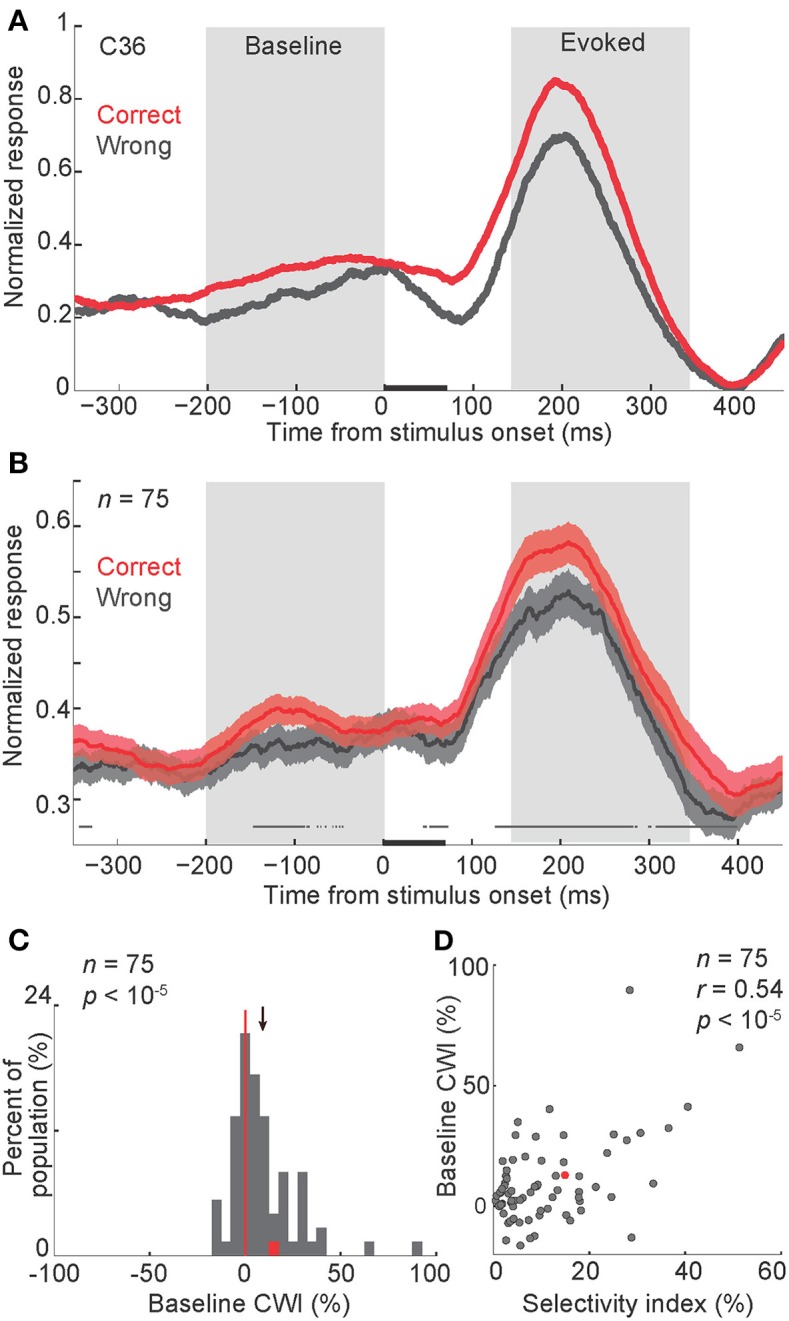
Figure 2.

Modulation of baseline activity in correct vs. wrong trials. (A,B) Normalized firing rate in correct and wrong trials, in a representative body neuron (C36, selectivity index = 0.15) (A), and across all neurons (B). In each neuron and each signal level, the peak response was measured separately in correct and wrong trials. The larger peak was selected to normalize both correct and wrong trials. Finally the normalized firing rates were averaged across noise levels. The gray boxes represent periods of baseline and evoked activity used for the further analysis. In (B) shaded areas represent s.e.m. of correct and wrong responses across the population. The line above the X-axis represents the significant difference between correct and wrong responses, obtained by paired t-test in 50-ms sliding windows with 1-ms steps, plotted at the middle of each bin (t-test, alpha = 0.05). Stimuli were presented for 70 ms, represented by a black bar on the X-axis. P-values represent the t-test results for comparing the firing rates between correct and wrong trials during baseline or evoked windows. “n” here and in all other figures represents the number of body neurons included in the analysis. (C) Histogram of the CWI (correct/wrong index) in the baseline period. The red data-point corresponds to the representative neuron shown in panel a (C36). The red vertical line shows the line of no difference (zero). The arrow represents the mean of the distribution. (D) The relationship of baseline CWI with the selectivity index. Each data-point corresponds to one neuron. Conventions as described in (C).
