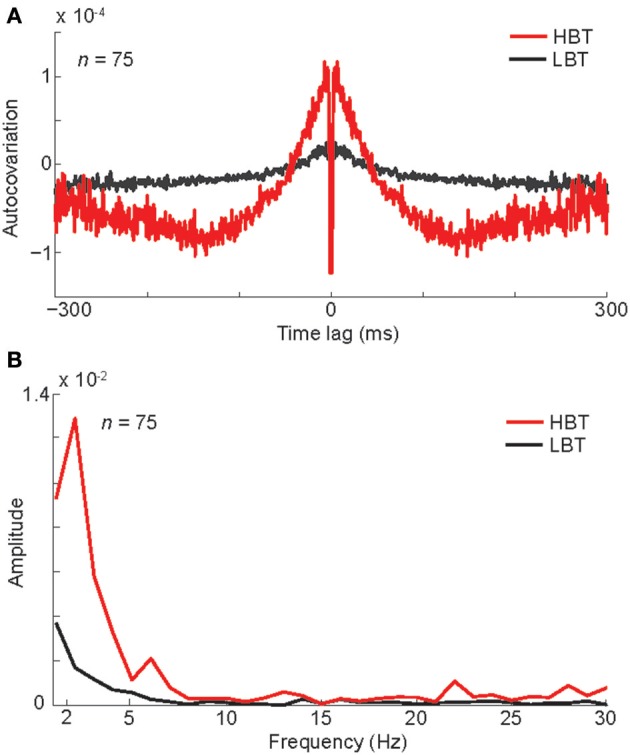
Figure 3.

Oscillation associated with different levels of baseline activity. (A) The auto-covariation plot for high baseline trials (HBT) and low baseline trials (LBT), measured during the baseline period (−300–0 ms). Low auto-covariation within 2 ms of the central time bin reflects the absolute refractory period of the isolated single units. (B) The FFT amplitude of the auto-covariation in HBT and LBT.
