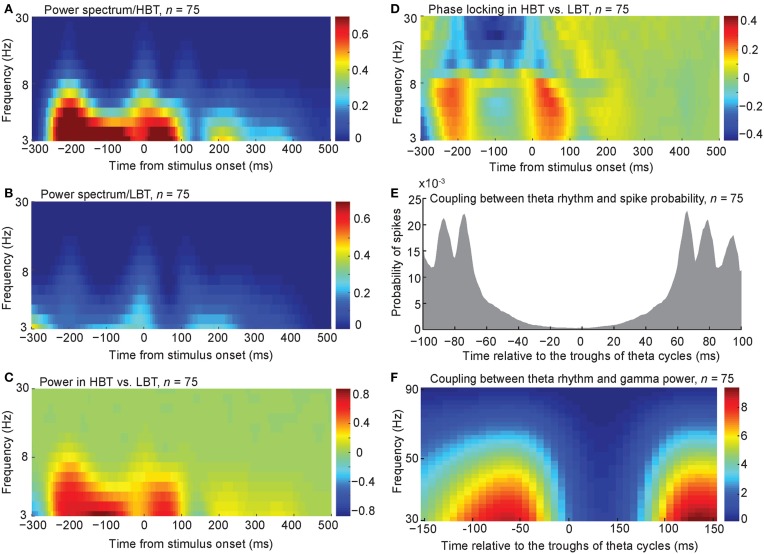
Figure 4.
Spectral power and phase associated with different levels of baseline activity. (A,B) The averaged spectral power of the population of body neurons in HBT (A), and LBT (B). (C) The difference of the spectral power in HBT vs. LBT. (D) The difference of the phase locking in HBT compared to LBT. (E) Coupling between the theta troughs and the spike probability. (F) Coupling between the theta troughs and the gamma power.

