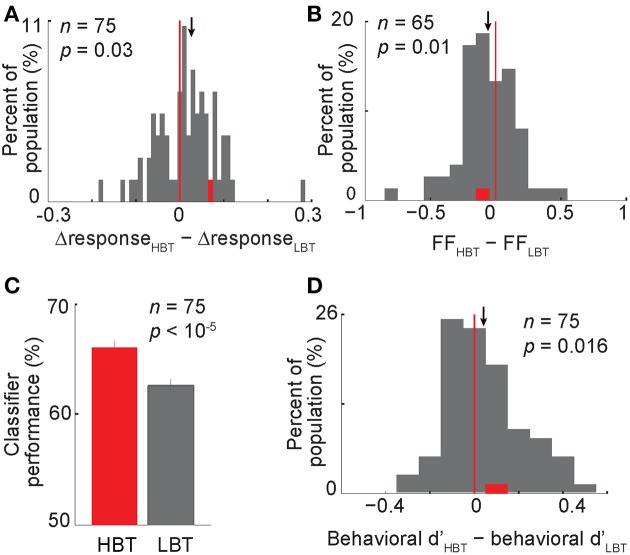
Figure 6.
Contribution of the baseline activity to the evoked response, neural and behavioral performance. (A) The histogram showing the modulation of the differential neural responses in HBT vs. LBT. This differential response (?response) was obtained by subtracting the normalized evoked response to non-body images from the normalized evoked response to body images. One data point (X = 0.91) was larger than the X-axis limit and is not shown here (B) The modulation of the rate-matched Fano factor in HBT vs. LBT. (C) The performance of a neural classifier in HBT and LBT. Error bars indicate the s.e.m. over 1000 repetitions of the classification in each condition. (D) The modulation of the behavioral dprime (d′) in HBT vs. LBT. Conventions as described in Figure 2.

