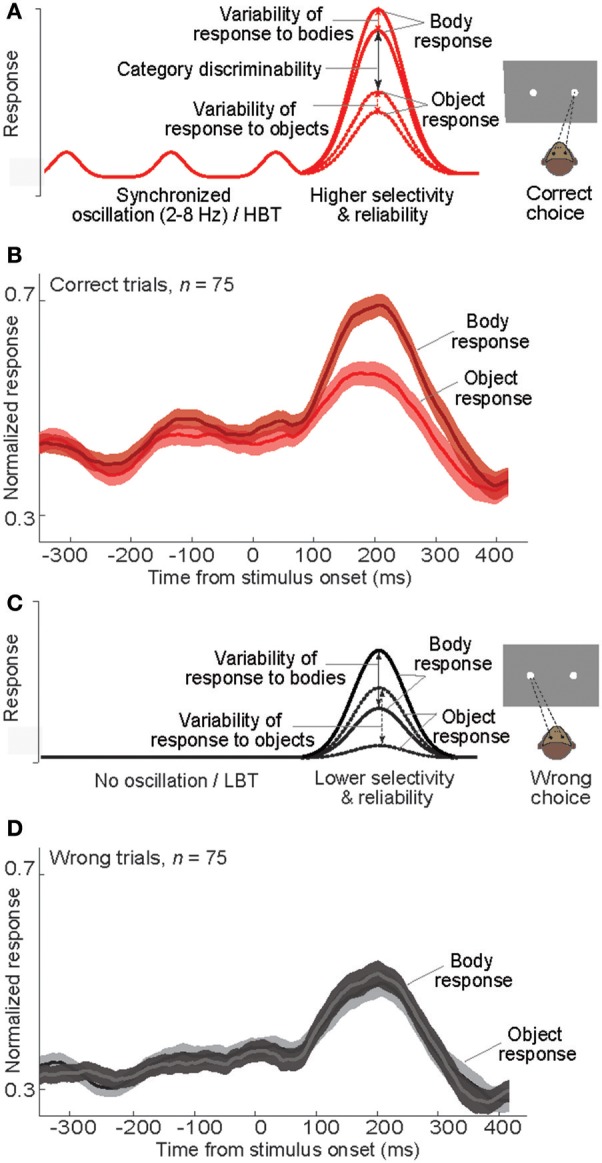
Figure 9.

Neural events following baseline modulation during a categorization task. (A) Schematic diagram of the mean response of a model body neuron responding to body and non-body images in “correct” trials. The impact of rhythmic baseline modulation on the neural response and behavior is illustrated. X-axis as in (B). (B) Plot of normalized averaged firing rate of body neurons in correct trials. In each neuron and each signal level, the firing rates were normalized by the peak response, and then the normalized firing rates were averaged. (C) Schematic diagram of the mean response of a model body neuron responding to body and non-body images in “wrong” trials. The impact of no baseline activity on the neural response and behavior is illustrated. X-axis as in (D). (D) Plot of normalized averaged firing rate of body neurons in wrong trials. Normalization was done similar to (B).
