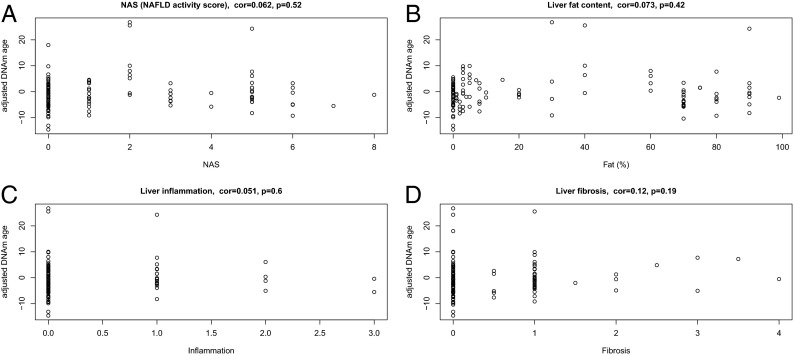
Fig. 3.
Post hoc analyses of subgroups and histological characteristics of NASH. An adjusted measure of DNAm age is related to various measures of liver pathology. The adjusted measure of DNAm age acceleration was defined as residual from a regression model that regressed DNAm age on chronological age+BMI+sex. Note that this adjusted measure of age acceleration does not relate to (A) NAS, (B) fat percentage (steatosis), (C) inflammation, and (D) fibrosis. Each scatterplot reports the Pearson correlation coefficient and P value. Analogous results can also be found in the individual liver datasets (Figs. S3 and S4).

