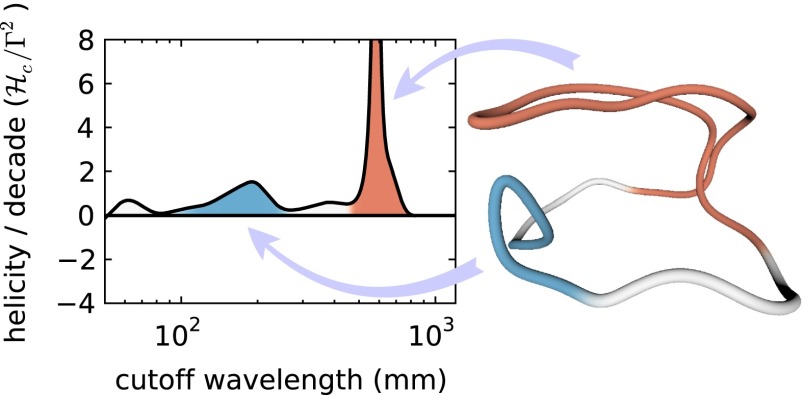
Fig. 3.
The coiling component of a helistogram for an experimental pair of linked rings just after the first reconnection (), with a colored image of the experimental data trace used to compute the helistogram. The peaks in the helistogram correspond to coils at two different length scales, which are color coded. In each case, the length of the segment colored is equal to the cutoff wavelength for that peak. Each coil contains approximately one unit of helicity.

