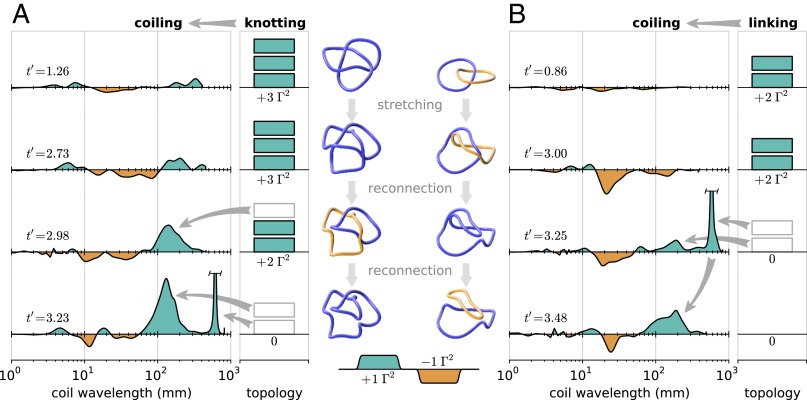
Fig. 4.
(A and B) Helistograms for A, a trefoil knot B, linked rings in a viscous fluid experiment (the dataset is the same as shown in Fig. 2 A–D; the total vortex length is m for both). The left portion of each series of plots shows the helicity contribution due to coiling on different spatial scales, obtained by computing , where λ is the cutoff wavelength for a windowed sinc smoothing. The right portion of each plot shows the irreducible contribution to the helicity originating from the global vortex topology. Both the coiling and topological contributions are scaled so that the total helicity is proportional to the filled area of the plots. The center column shows images of the numerically traced vortices smoothed to mm.

