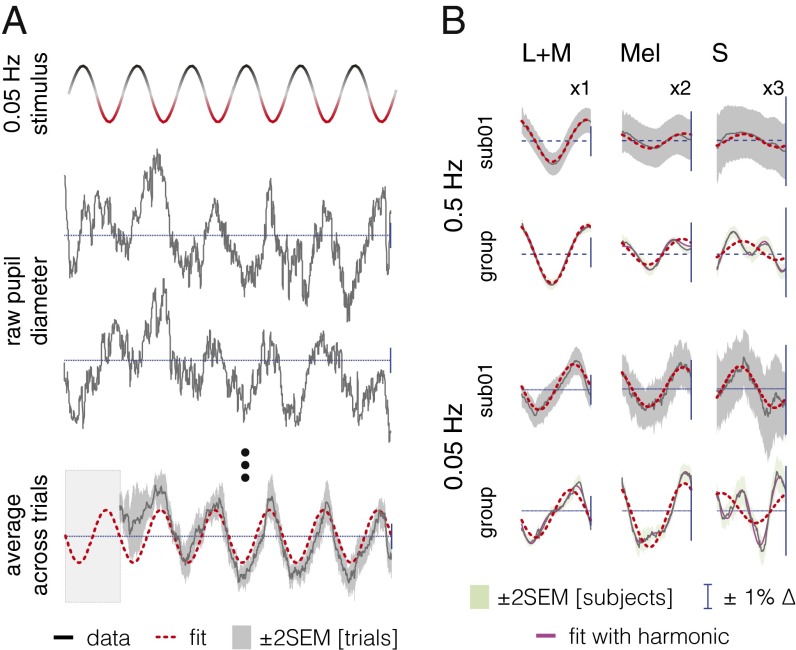
Fig. 2.
S input to the PLR is opponent to L+M and melanopsin. (A, Top) Stimulus modulation over time between positive and negative spectra. (Middle) Pupil traces for two 120-s trials (sub01, 0.05 Hz, L+M). (Bottom) Average data (12 trials; same subject/condition; first 20 s discarded) fit with a sinusoid at the stimulus fundamental. (B) One cycle of the PLR [sub01 and group average over 16 subjects (black lines); melanopsin responses ×2 scale, S responses ×3]. Red dashed lines show fit with fundamental. Where visible, magenta lines are the fits with fundamental and second harmonic.

